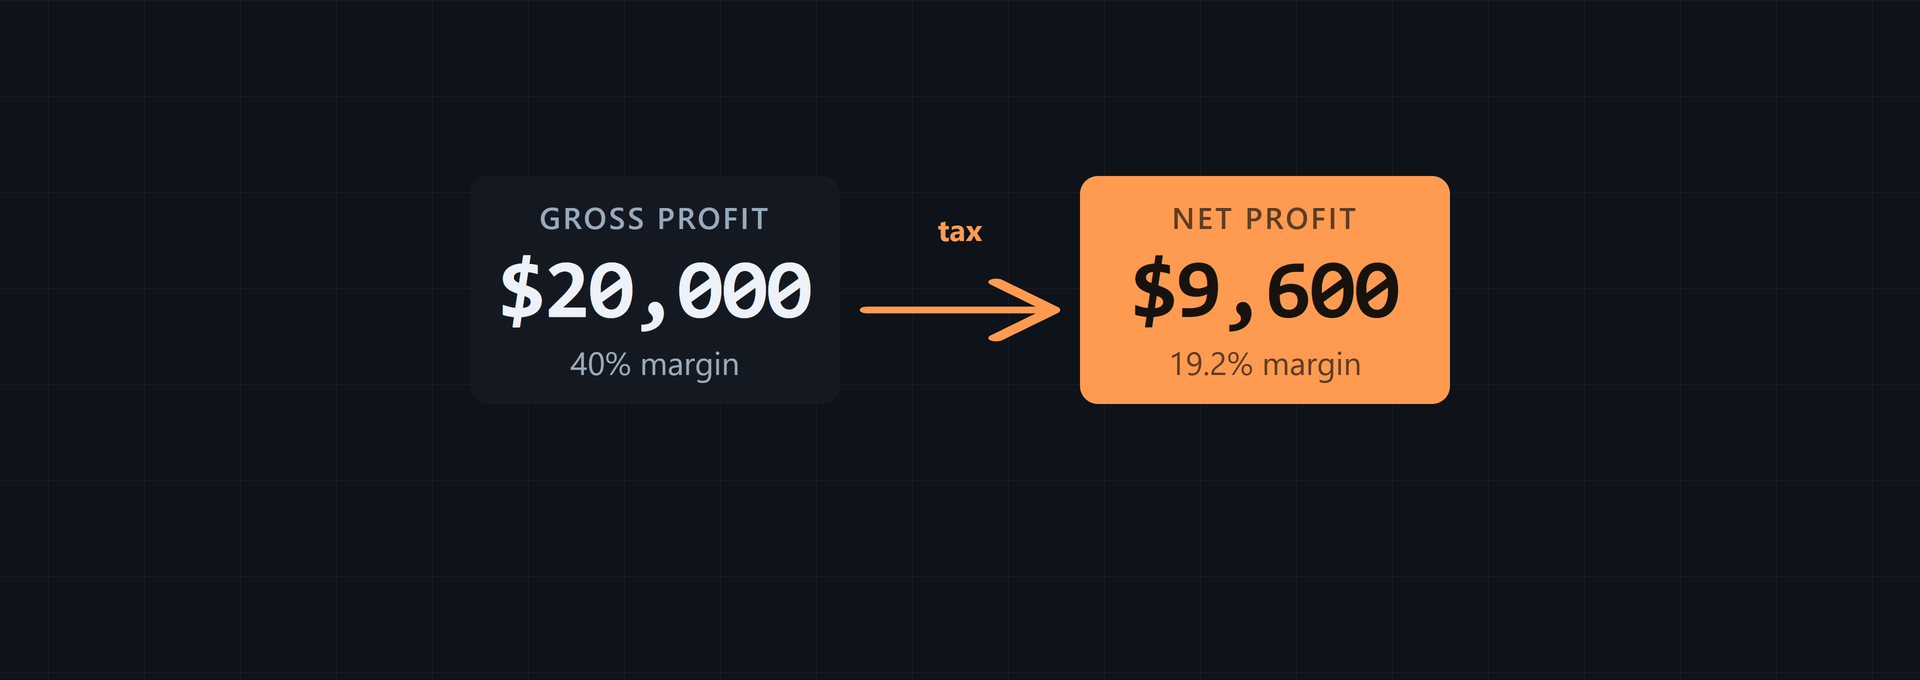
These gross profit formula examples start with net sales and COGS, then show how changes in inventory, materials, selling price, and direct labor change gross profit and margin. The same figures are used in the Business Profit Calculator so each case can be checked as a what-if calculation.
How the gross profit formula works with COGS
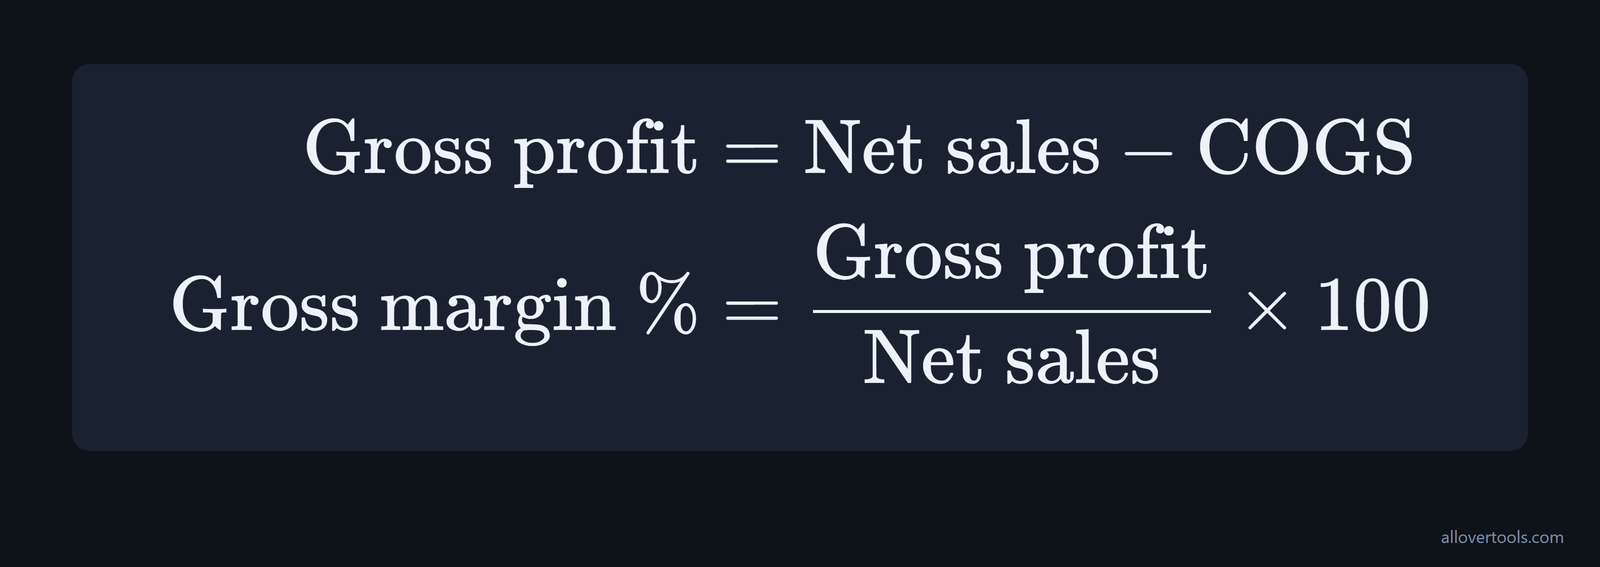
Subtract COGS from net sales to get gross profit. The formula is Gross profit = Net sales - COGS. Gross margin expresses that result as a percentage of net sales: Gross margin % = Gross profit / Net sales x 100.
For S&P 500 companies, gross margin is the first and most important profitability gate in income-statement analysis. A COGS-driven change therefore deserves attention before operating expenses or net income, as Basis Report's definition explains.
Do not call a percentage good or bad on its own; compare it with a sector benchmark. As of 2026, gross margins range from 28% in Energy to 72% in Software (SaaS). SaaS has a 72% median, an 82% top quartile and a 60% bottom quartile. Technology has a 55% median, and Consumer Staples has a 38% median, according to the 2026 sector benchmark.
| Sector or group | Gross margin figure |
|---|---|
| Energy | 28% |
| Software (SaaS) median | 72% |
| Software (SaaS) top quartile | 82% |
| Software (SaaS) bottom quartile | 60% |
| Technology median | 55% |
| Consumer Staples median | 38% |
Gross margin can also move materially over time within one sector, so compare the result with the industry and the matching year. ReadyRatios reports an All Industries margin of 41.5% in 2020, 41.6% in 2021, 40.3% in 2022, 41% in 2023 and 43.6% in 2024. Oil and Gas Extraction moves from 13% in 2020 to 35.8% in 2021, 44.9% in 2022, 37.8% in 2023 and 32.8% in 2024, as shown in the industry ratios table.
| Group | 2020 | 2021 | 2022 | 2023 | 2024 |
|---|---|---|---|---|---|
| All Industries | 41.5% | 41.6% | 40.3% | 41% | 43.6% |
| Oil and Gas Extraction | 13% | 35.8% | 44.9% | 37.8% | 32.8% |
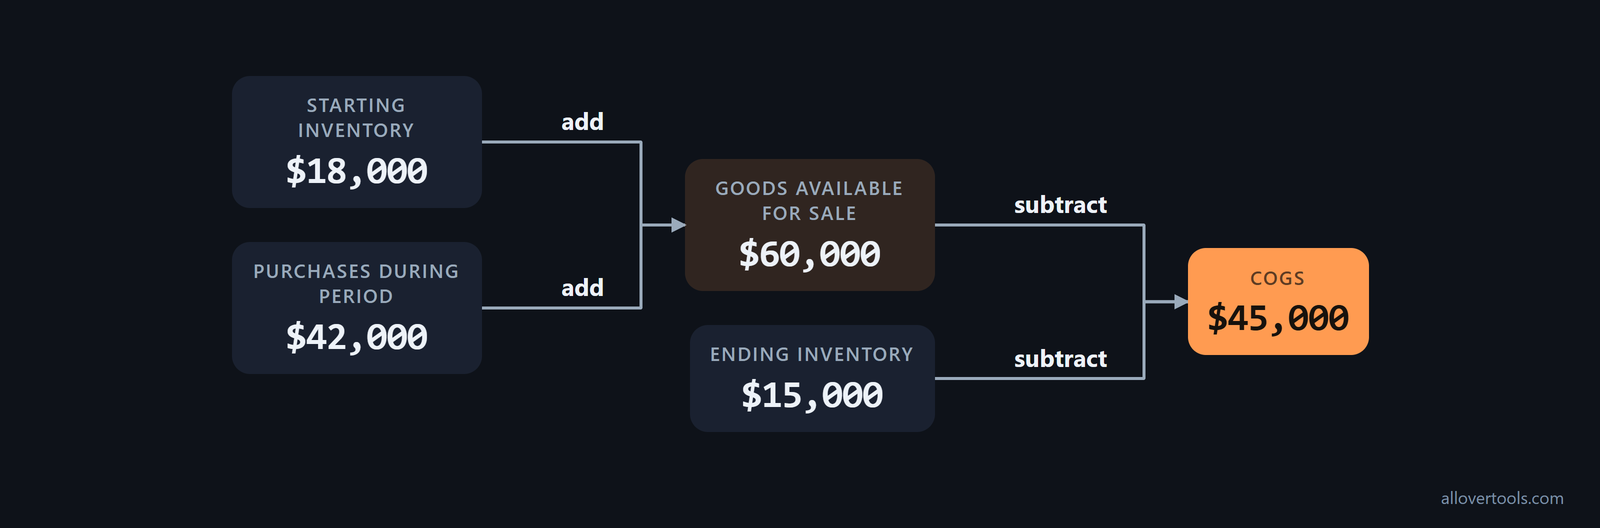
COGS can include direct materials, direct labor, and other direct costs tied to the goods sold. When inventory records provide the inputs, use COGS = Starting inventory + Purchases during period - Ending inventory. Gross profit is calculated as Net sales - COGS.
From inventory records to COGS
Use these values for one period, with the same business scope for each input:
Starting inventory:       $18,000
Purchases during period:  $42,000
Goods available for sale: $60,000
Ending inventory:         $15,000
COGS:                     $45,000
Add starting inventory and purchases to get goods available for sale: $18,000 + $42,000 = $60,000. Then subtract ending inventory: $60,000 - $15,000 = $45,000. In the Cost of Goods Sold Calculator, enter Starting inventory, Purchases during period, and Ending inventory, then select Calculate COGS.
The COGS tool does not accept ending inventory above goods available for sale. Fix the inputs before carrying the COGS figure into the next calculation.
From COGS to gross margin
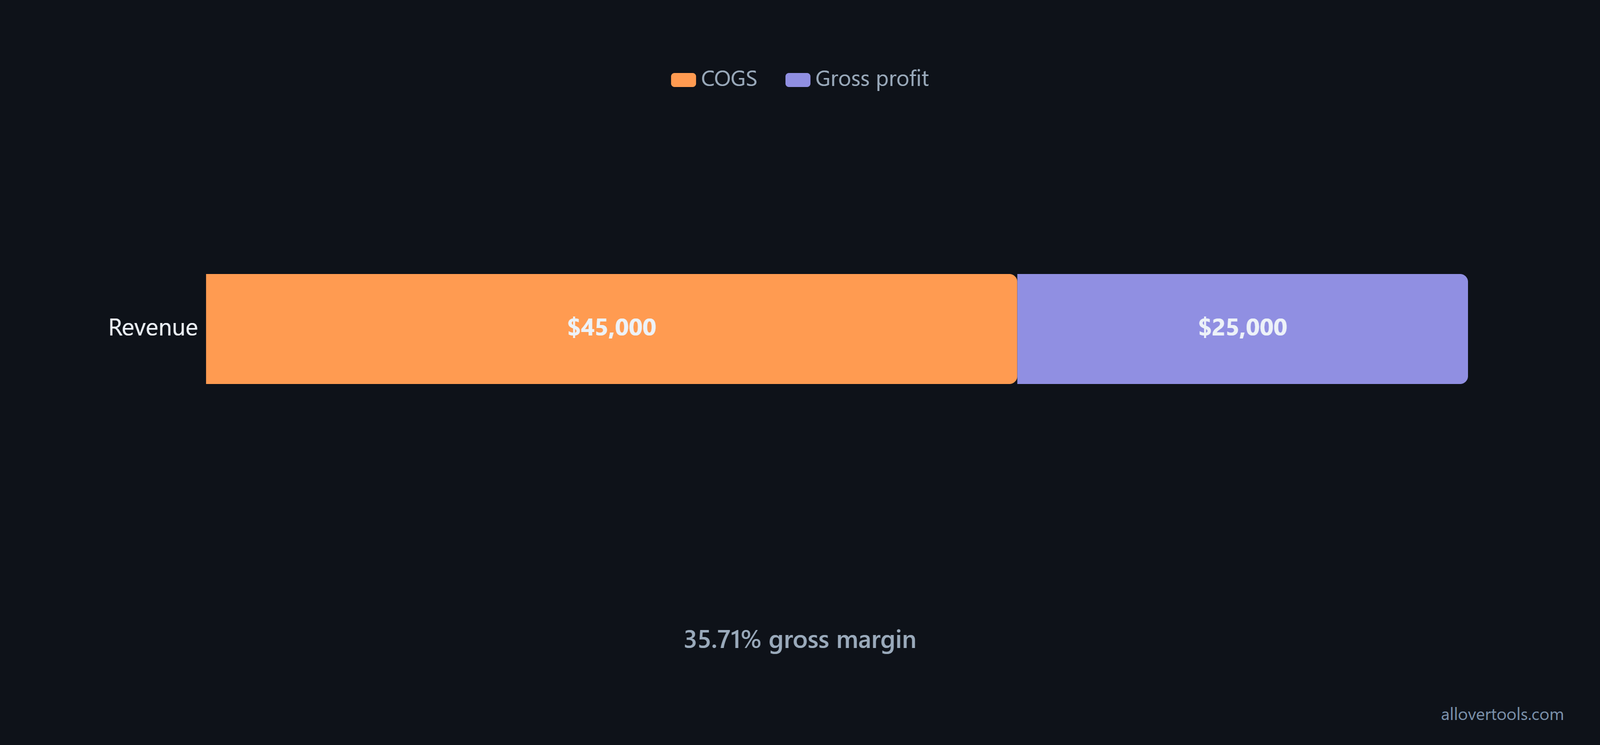
Now use revenue of $70,000 and COGS of $45,000:
Gross profit: $70,000 - $45,000 = $25,000
Gross margin: $25,000 / $70,000 x 100 = 35.71%
After COGS, $25,000 remains. Gross margin puts that amount on a net-sales basis, giving 35.71%. Enter Revenue of $70,000 and Cost of goods sold (COGS) of $45,000 in the Business Profit Calculator. To check the percentage separately, enter Revenue and Direct cost in the Gross Margin Calculator.
What happens when COGS or selling price changes
Each case starts with revenue of $50,000, COGS of $30,000, gross profit of $20,000, and gross margin of 40%. Only one practical driver changes at a time. The Business Profit Calculator can repeat each Revenue and COGS pair.
Before changing an input, separate the part of COGS that stays stable from the part that moves with output. Fixed costs do not vary with production levels, while variable costs fluctuate with production output. Common variable COGS includes raw materials, production supplies, wages for labor required to produce goods, and production-facility utilities. When these expenses rise, gross profit falls, as the cost-structure explanation sets out.
- For a fixed-cost change, keep the production level and variable inputs visible. Otherwise, the scenario may imply that every COGS line rises with output.
- For a variable-cost change, alter the raw materials, supplies, production wages, or facility utilities that drive the case, then carry the new COGS into the formula.
Rising material costs with sales unchanged
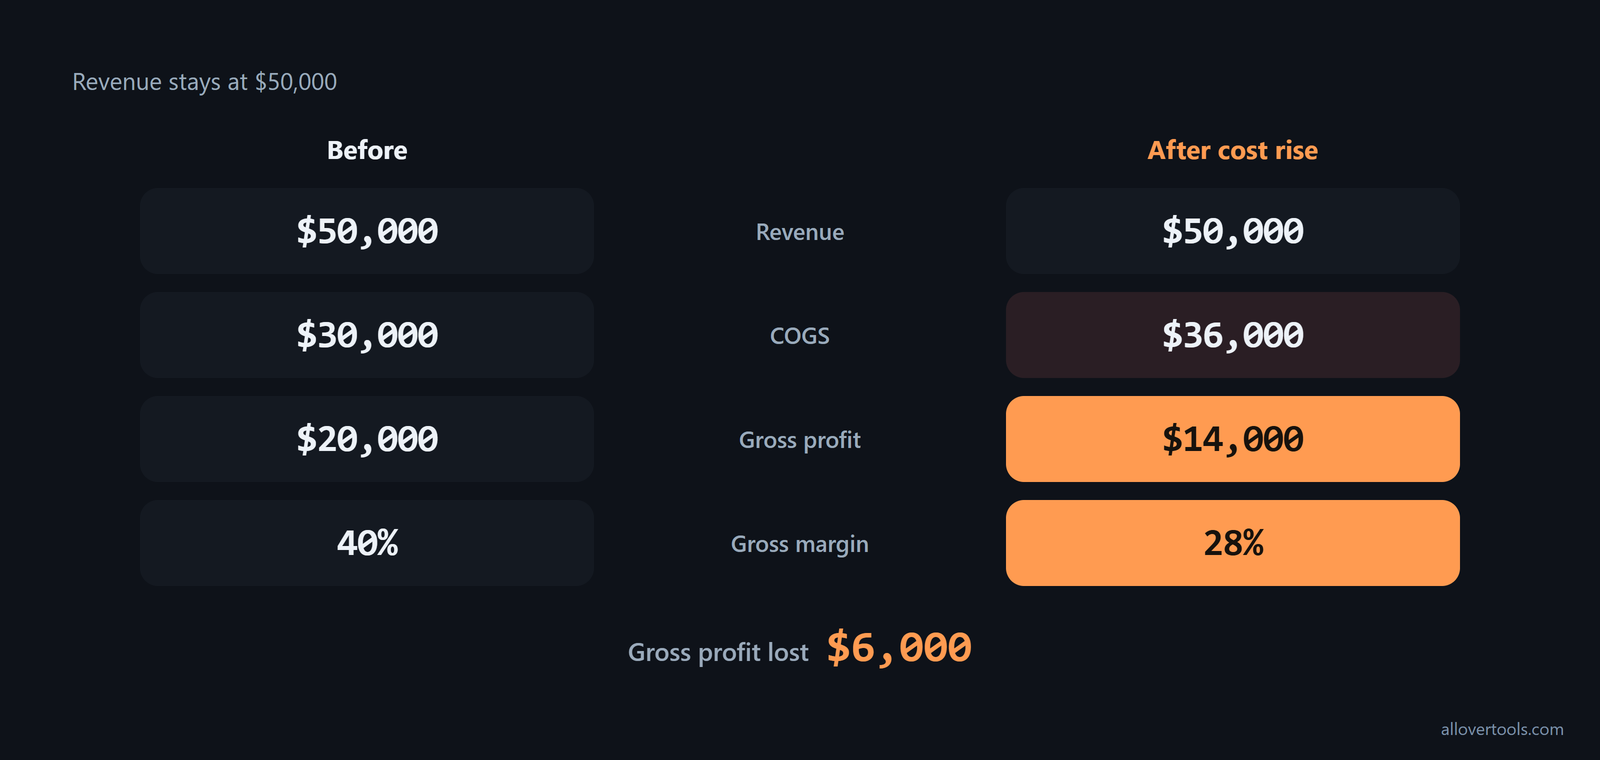
Revenue stays at $50,000. The starting calculation is:
$50,000 - $30,000 = $20,000 gross profit
$20,000 / $50,000 x 100 = 40% gross margin
When higher material costs raise COGS to $36,000, the result becomes:
$50,000 - $36,000 = $14,000 gross profit
$14,000 / $50,000 x 100 = 28% gross margin
The $6,000 increase in COGS takes $6,000 from gross profit. Gross margin falls 12 percentage points, from 40% to 28%, even though sales remain $50,000.
Discounting and promotions
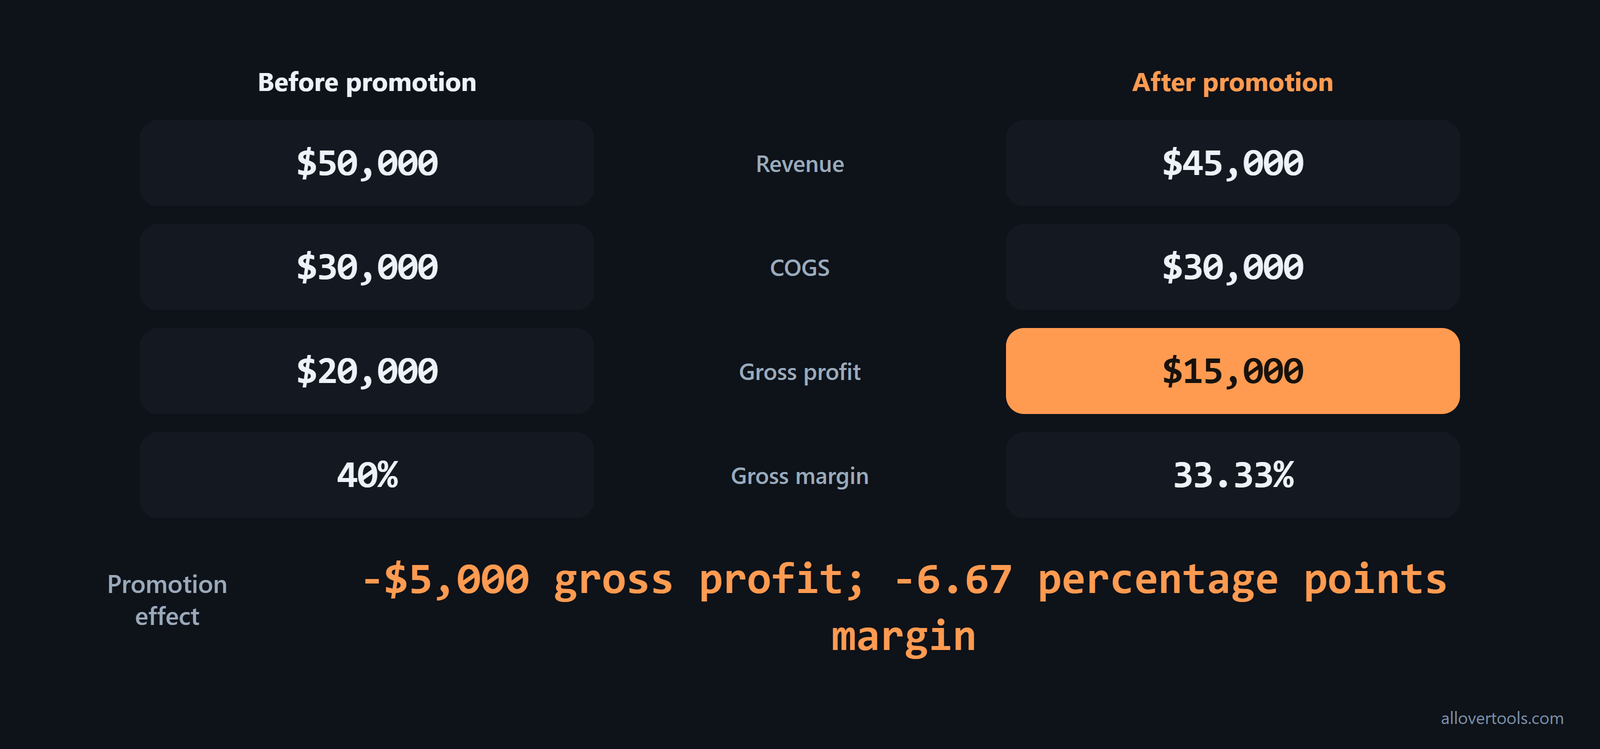
Hold COGS at $30,000 to isolate the selling-price change. At revenue of $50,000, gross profit is $20,000 and gross margin is 40%. If a promotion lowers revenue to $45,000:
$45,000 - $30,000 = $15,000 gross profit
$15,000 / $45,000 x 100 = 33.33% gross margin
Because COGS stays the same in this example, the $5,000 reduction in revenue also reduces gross profit by $5,000. Margin falls 6.67 percentage points, from 40% to 33.33%.
Use net sales, not total invoiced sales, when returns or allowances reduce what the business keeps. In a bicycle manufacturing example, $60,000 of sales revenue less $1,000 of returns and allowances and $25,000 of spare parts, materials, and direct labor gives $34,000 gross profit, as shown in the worked calculation. Enter the adjusted sales amount before subtracting COGS when testing a discount, return, or quality-related case.
Check the per-unit result before scaling it to a period total. A bottled-water example gives £0.50 gross profit per bottle from a £0.99 selling price minus a £0.49 variable cost. Multiplying that amount by 10,000 bottles gives £5,000 per day, according to the unit-margin example.
Gross profit per bottle: £0.99 - £0.49 = £0.50
Gross profit per day:    £0.50 x 10,000 = £5,000
Productivity improvements in direct labor
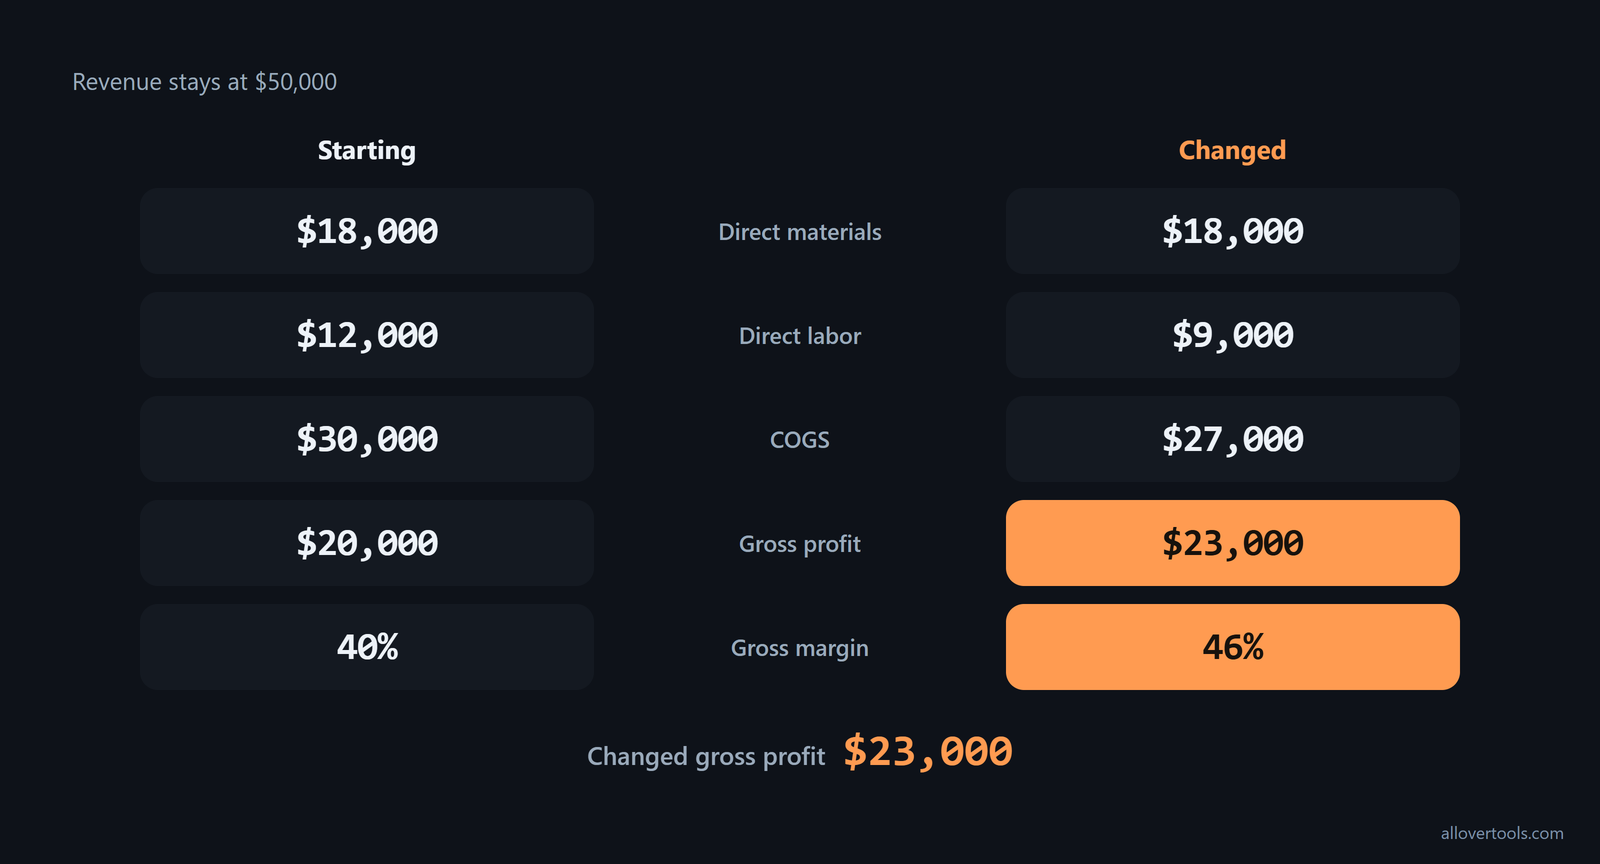
Revenue remains $50,000. Direct materials stay at $18,000, while direct labor falls from $12,000 to $9,000:
Starting COGS: $18,000 + $12,000 = $30,000
Changed COGS:  $18,000 + $9,000  = $27,000
Gross profit:  $50,000 - $27,000 = $23,000
Gross margin:  $23,000 / $50,000 x 100 = 46%
The $3,000 reduction in direct labor lowers COGS by $3,000. Gross profit rises from $20,000 to $23,000, and gross margin rises from 40% to 46%.
To isolate the effect of COGS, compare businesses with the same net sales. Company A has $100 in net sales and $60 in COGS, leaving $40 gross profit and a 40% gross margin. Company B has the same $100 in net sales but $80 in COGS, leaving $20 gross profit and a 20% gross margin, as the comparison example shows.
| Company | Net sales | COGS | Gross profit | Gross margin |
|---|---|---|---|---|
| Company A | $100 | $60 | $40 | 40% |
| Company B | $100 | $80 | $20 | 20% |
How to test gross profit what-if cases in the calculators
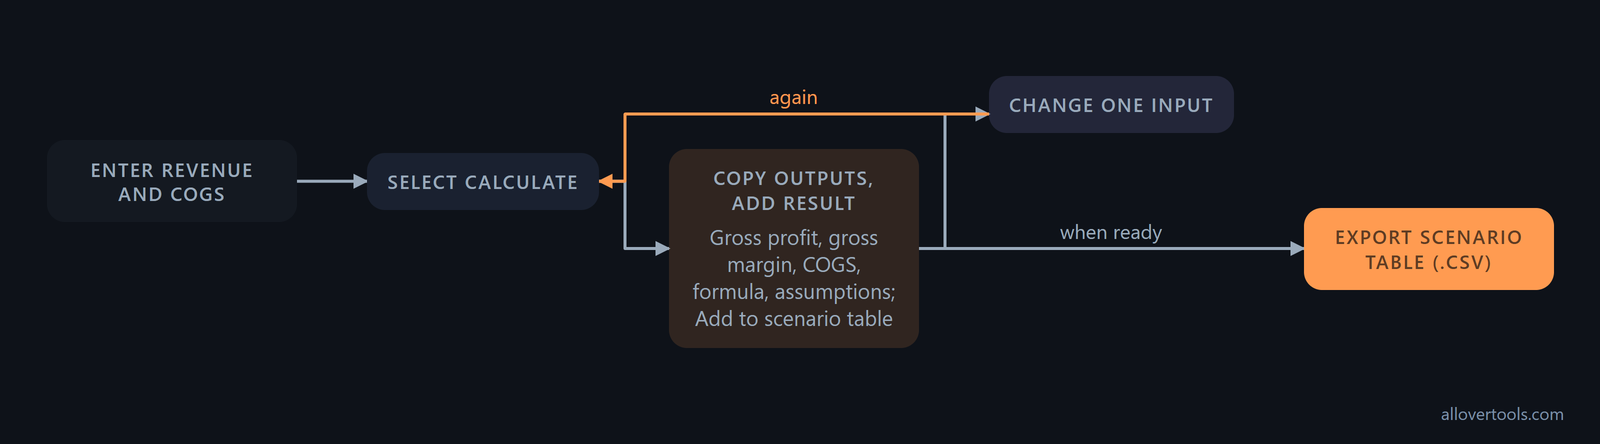
In the Business Profit Calculator, choose Calculation mode COGS & gross profit / margin. Enter Revenue and Cost of goods sold (COGS), choose a Period label and Currency symbol, and select Calculate. Note the displayed Gross profit, Gross margin, COGS, formula, and assumptions. Then change one input and calculate again.
Build and compare a scenario table
- Enter one Revenue and Cost of goods sold (COGS) pair.
- Select Calculate and copy Gross profit, Gross margin, COGS, formula, and assumptions into notes.
- Select Add to scenario table to store the result.
- Change one input, select Calculate again, and add the new result.
- Select Export scenario table (.csv) when the comparison is ready.
Changing one input makes the source of the difference easier to see. For an inventory-based case, enter Starting inventory, Purchases during period, and Ending inventory in the Cost of Goods Sold Calculator, select Calculate COGS, and carry that result into the Business Profit Calculator. For a direct-cost check, enter Revenue and Direct cost in the Gross Margin Calculator and select Calculate.
Check the input basis before trusting the output
Keep revenue and COGS on the same period and business scope. Match beginning and ending inventory with the purchases used in the inventory calculation. Period labels the result but does not convert figures. Currency symbol changes the display only. The calculators use the numbers entered in the browser and do not send visitor content in a network request.
What gross profit leaves out and how to keep COGS accurate
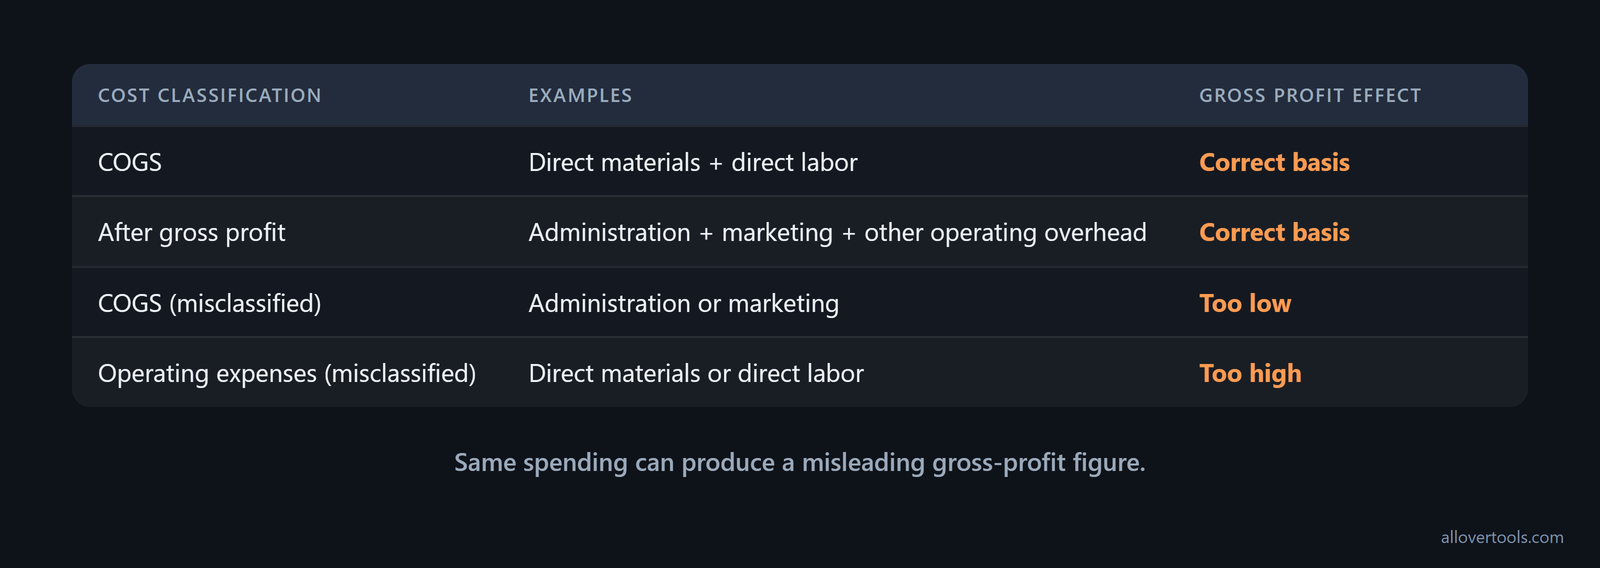
The calculation subtracts COGS, not every business expense. Materials and direct labor tied to goods sold belong in COGS for these examples. General administration, marketing, and other operating overhead are accounted for after gross profit.
What counts as a direct cost depends on what the business delivers. Sarah's product example has 500 phone cases at $30 each, or $15,000 revenue. Materials of $4,000, direct labor of $2,500, and shipping supplies of $500 total $7,000 COGS, leaving $8,000 gross profit. Tom's landscaping business has $22,000 revenue; crew wages of $6,000, fuel and equipment maintenance of $2,000, and supplies of $1,000 total $9,000 COGS, leaving $13,000 gross profit, as Xero's paired examples show.
| Business | Revenue | COGS components | Total COGS | Gross profit |
|---|---|---|---|---|
| Product: phone cases | $15,000 | $4,000 materials; $2,500 direct labor; $500 shipping supplies | $7,000 | $8,000 |
| Service: landscaping | $22,000 | $6,000 crew wages; $2,000 fuel and equipment maintenance; $1,000 supplies | $9,000 | $13,000 |
Misclassified expenses can distort gross profit
Adding administration or marketing overhead to COGS makes gross profit look too low because the calculation includes costs outside the direct-cost boundary. Leaving direct materials or direct labor in operating expenses makes gross profit look too high because COGS is missing costs tied to the goods sold. Total spending can stay the same while the gross-profit figure becomes misleading.
The donut-shop example breaks several production costs into one COGS figure. Revenue is $209,060, COGS is $122,155, and gross profit is $86,905. The COGS total includes dough ingredients of $18,670, icing ingredients of $10,050, coffee beans of $16,065, toppings and add-ons of $10,000, paper bags of $3,700, napkins, cups and lids of $5,000, and wages for staff in production roles of $58,670, according to the itemized business example.
| Donut-shop COGS item | Amount |
|---|---|
| Ingredients for dough | $18,670 |
| Ingredients for icing | $10,050 |
| Coffee beans | $16,065 |
| Toppings and add-ons | $10,000 |
| Paper bags | $3,700 |
| Napkins, cups and lids | $5,000 |
| Wages for staff in production roles | $58,670 |
| Total COGS | $122,155 |
Gross profit versus operating profit
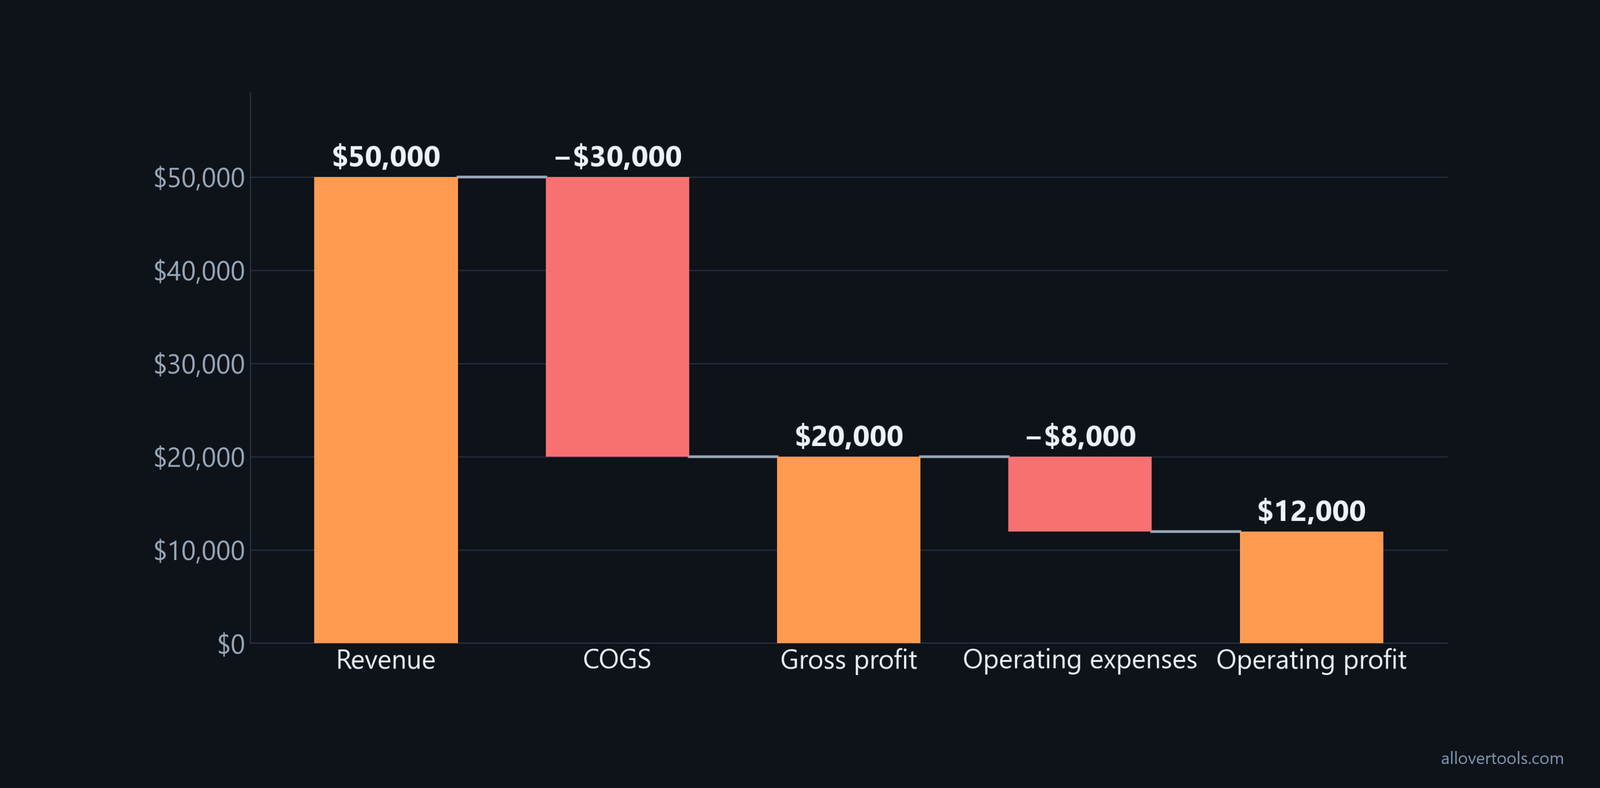
Use revenue of $50,000, COGS of $30,000, and operating expenses or overhead of $8,000:
Gross profit:     $50,000 - $30,000 = $20,000
Operating profit: $20,000 - $8,000  = $12,000
The second subtraction accounts for operating expenses, so those costs are not part of the gross-profit formula. In the Business Profit Calculator's Net profit margin mode, the relationship appears as Operating profit = Gross profit - Operating expenses. Enter Revenue, Cost of goods sold (COGS), and Operating expenses / overhead in the Business Profit Calculator to see the bridge.
Record-keeping checks for accurate COGS
- Reconcile starting and ending inventory.
- Record purchases for the same period as the inventory values.
- Separate direct materials and direct labor from overhead.
- Document promotional price changes and their assumptions.
- Keep revenue and COGS on the same scope before entering figures.
The inventory calculator rejects ending inventory above goods available for sale. The Gross Margin Calculator rejects Direct cost above Revenue instead of showing a negative gross profit. Correct the figures before relying on either result.
Frequently asked questions
What is the gross profit formula?
Use Gross profit = Net sales - COGS. COGS is the direct cost of what was sold. Gross margin divides gross profit by net sales and expresses the result as a percentage.
How does higher COGS affect gross profit if sales stay the same?
Higher COGS reduces gross profit dollar for dollar when net sales do not change, and it also lowers gross margin. In the rising-material-cost case, COGS increases from $30,000 to $36,000 while revenue stays at $50,000.
Is gross profit the same as gross margin?
No. Gross profit is the currency amount left after COGS. Gross margin is that amount divided by net sales and shown as a percentage.
What goes into the COGS formula from inventory?
Use Starting inventory + Purchases during period - Ending inventory. The inventory values and purchases must cover the same accounting period and business scope.
How is gross profit different from operating profit?
The first step subtracts COGS from net sales. Operating profit then subtracts operating expenses or overhead from that result, keeping those costs outside the gross-profit calculation.