The link between break-even and profit comes down to three inputs: fixed costs, variable cost per unit, and selling price. From them, you can calculate the contribution margin, the units needed to cover costs, and the revenue that goes with those units. The same calculation also shows how many sales are needed to reach a chosen profit.
How break-even and profit are connected
Profit is income minus expenses. For a product or service, that means revenue minus total costs. Break-even is the point where revenue and total costs match, so profit is zero.
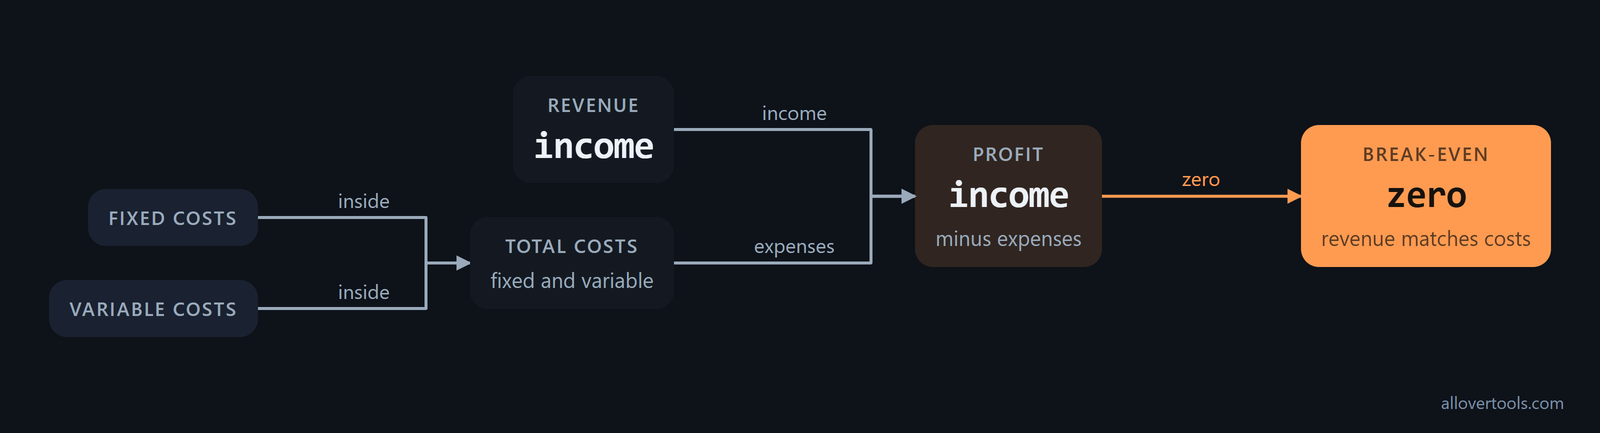
Sort the costs before doing the calculation. Fixed costs do not change with the number of units sold during the period being analyzed, such as monthly rent. Variable costs move with sales, such as materials or a payment fee charged per transaction. Set the period first: monthly fixed costs must be compared with monthly sales, not an annual sales figure.
Contribution margin and break-even formulas
Contribution margin per unit is the price per unit minus the variable cost per unit. Each sale leaves this amount after its variable cost. It pays fixed costs first; once those are covered, additional contribution becomes profit. The contribution margin ratio is contribution margin per unit divided by price per unit.
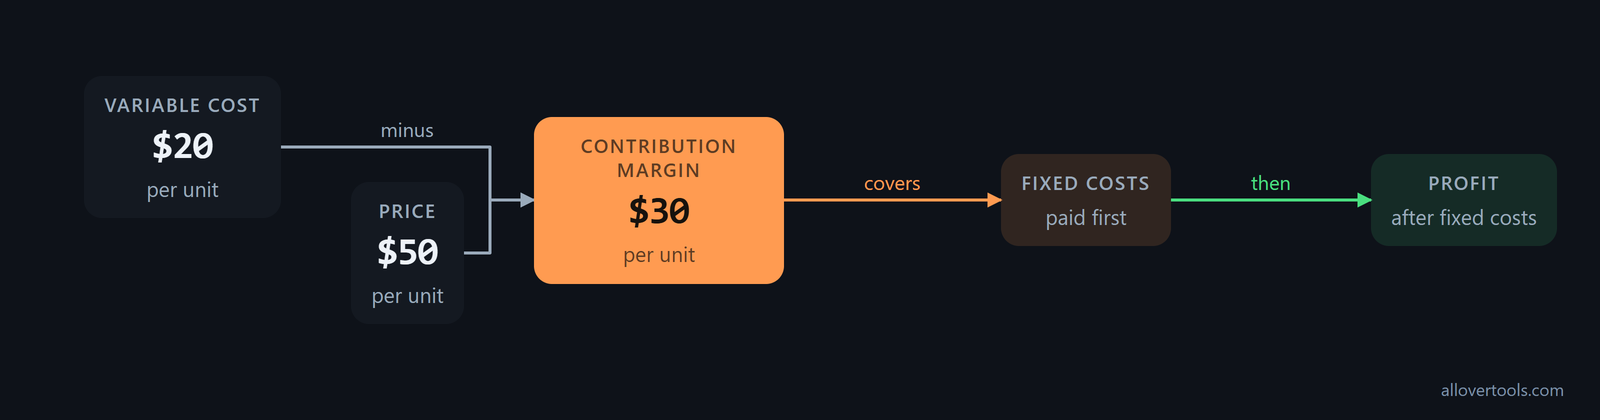
Keep the fixed costs, price, and variable cost tied to the same period or unit definition. If variable cost is equal to or above price, the contribution margin is zero or negative. Each sale then contributes nothing positive toward fixed costs, so this method cannot produce a break-even point.
The Break-Even Revenue Calculator accepts the controls "Fixed costs per period", "Price per unit", and "Variable cost per unit". Select "Calculate break-even" to see the formulas, assumptions, units, revenue, and contribution margin. Its script does not send entered values in a network request, so the calculation stays in the browser.
The two break-even formulas
Find the contribution margin per unit first, then use it as the denominator in the units formula.
Break-even units = Fixed costs per period / Contribution margin per unit
Break-even revenue = Break-even units x Price per unit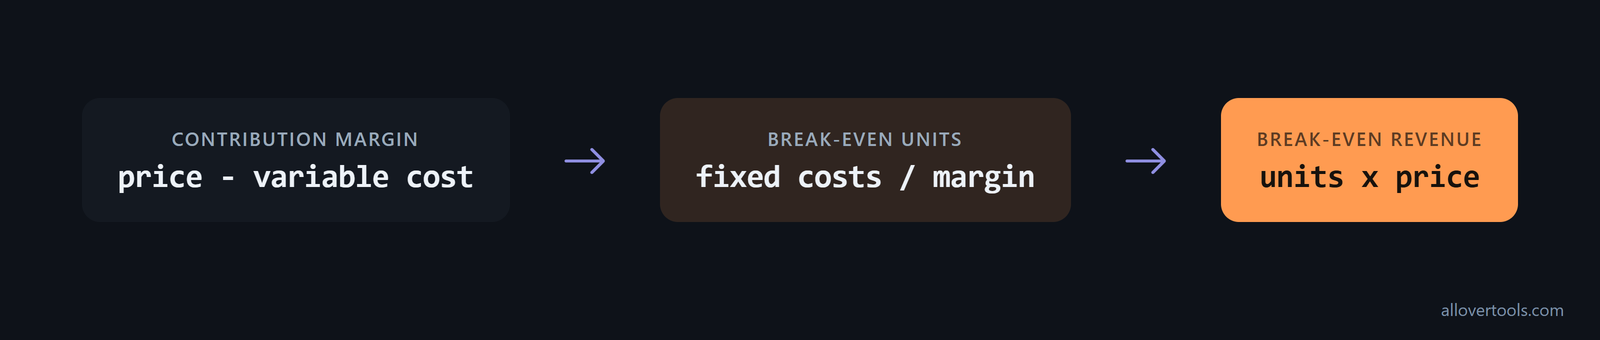
Multiply the calculated units by the price per unit to get revenue. This revenue is higher than fixed costs because it also includes the variable cost of the units sold.
What a positive contribution margin tells you
The contribution margin ratio is the share of each sale available for fixed costs and profit. A 60% ratio means that $0.60 of each $1.00 sale remains after the variable cost under the chosen inputs. It is not the final net profit margin because fixed costs still have to be paid.
Worked break-even calculation with chosen values
These are chosen values, not business benchmarks: $10,000 in fixed costs per month, a $50 price per unit, and a $20 variable cost per unit.
Inputs, contribution margin, and minimum sales
Subtract the variable cost from the price, then use the result in the break-even formulas.
Contribution margin per unit = $50 - $20 = $30
Contribution margin ratio = $30 / $50 = 60%
Break-even units = $10,000 / $30 = 333.333...
Break-even revenue = 333.333... x $50 = $16,666.666...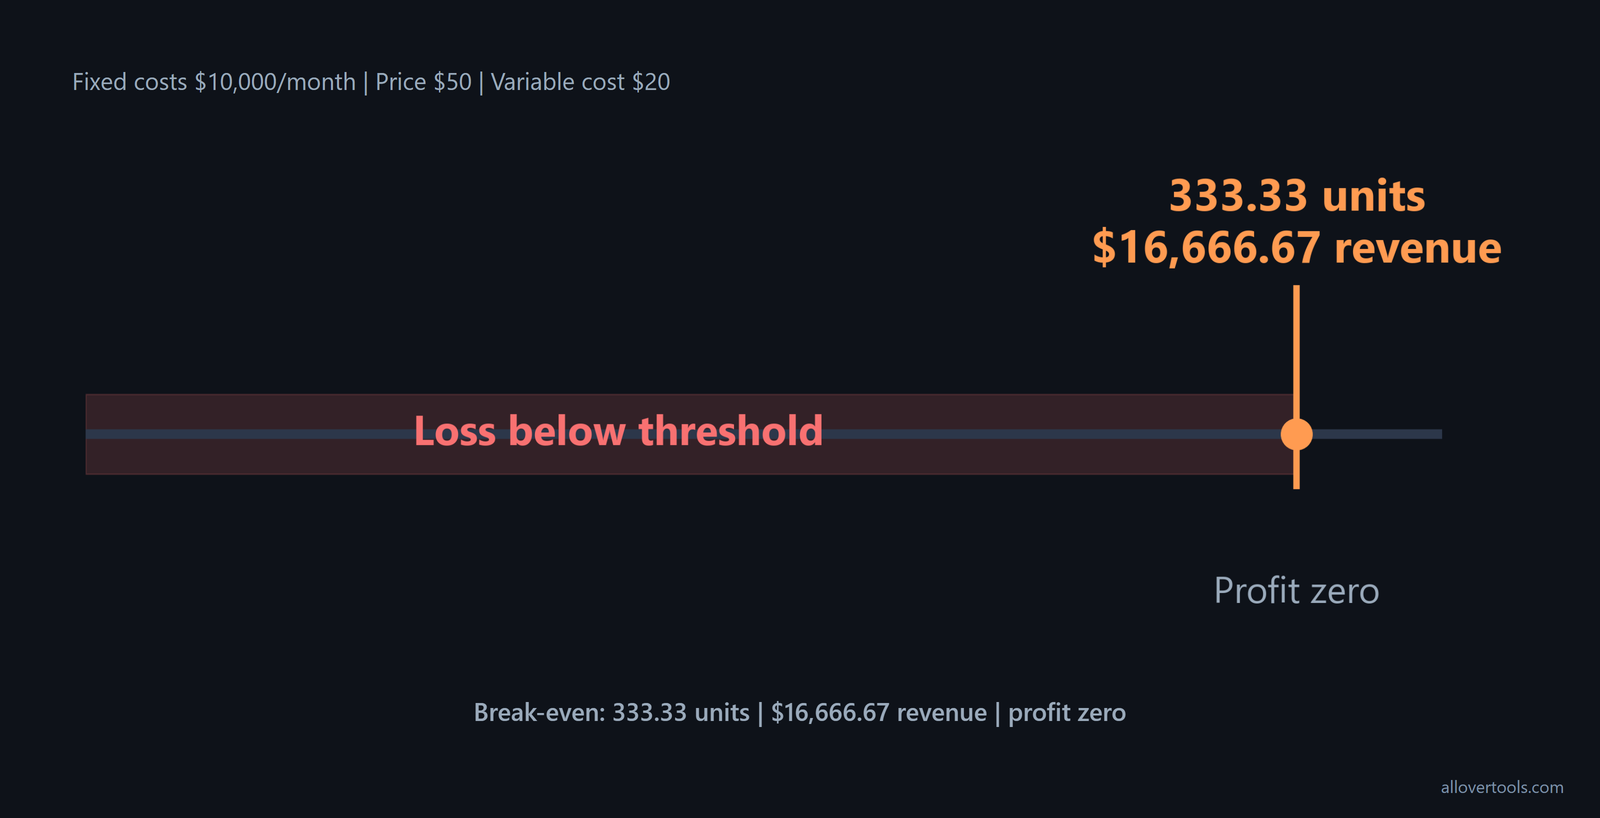
Shown to two decimal places, the results are 333.33 units per period and $16,666.67 per period. Revenue below that amount produces a loss under these assumptions. At the mathematical threshold, revenue equals total costs and profit is zero. The calculator displays the decimal; a plan based on whole units may need the next whole unit.
How to reproduce the example in the calculator
- Choose the currency symbol.
- Enter
10000in "Fixed costs per period". - Enter
50in "Price per unit". - Enter
20in "Variable cost per unit". - Select "Calculate break-even".
- Read the result and the assumptions table.
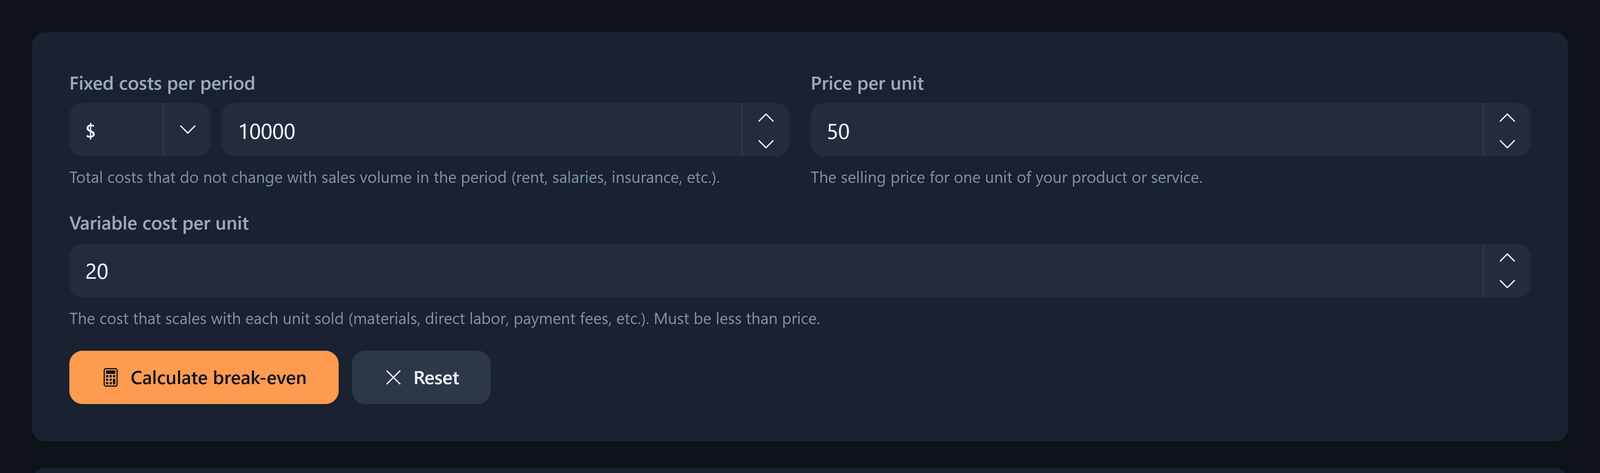
The currency selector changes the symbol but does not convert the values. "Copy result" and "Download result (.txt)" save the displayed calculation. Invalid input hides the result, including a variable cost per unit equal to or greater than the price.
From break-even to a target profit
To model a target profit, add it to fixed costs before dividing by contribution margin. The required sales will then be above the point where profit is zero.
Target units and target revenue
Keep the chosen $10,000 fixed costs, $50 price, and $20 variable cost. Add a target profit of $5,000.
Target units = (Fixed costs + Target profit) / Contribution margin per unit
Target units = ($10,000 + $5,000) / $30 = 500 units
Target revenue = 500 x $50 = $25,000
Target revenue is the sales amount, not the amount retained as profit. The result checks out as follows:
$25,000 revenue - ($10,000 fixed costs + $10,000 variable costs) = $5,000 profit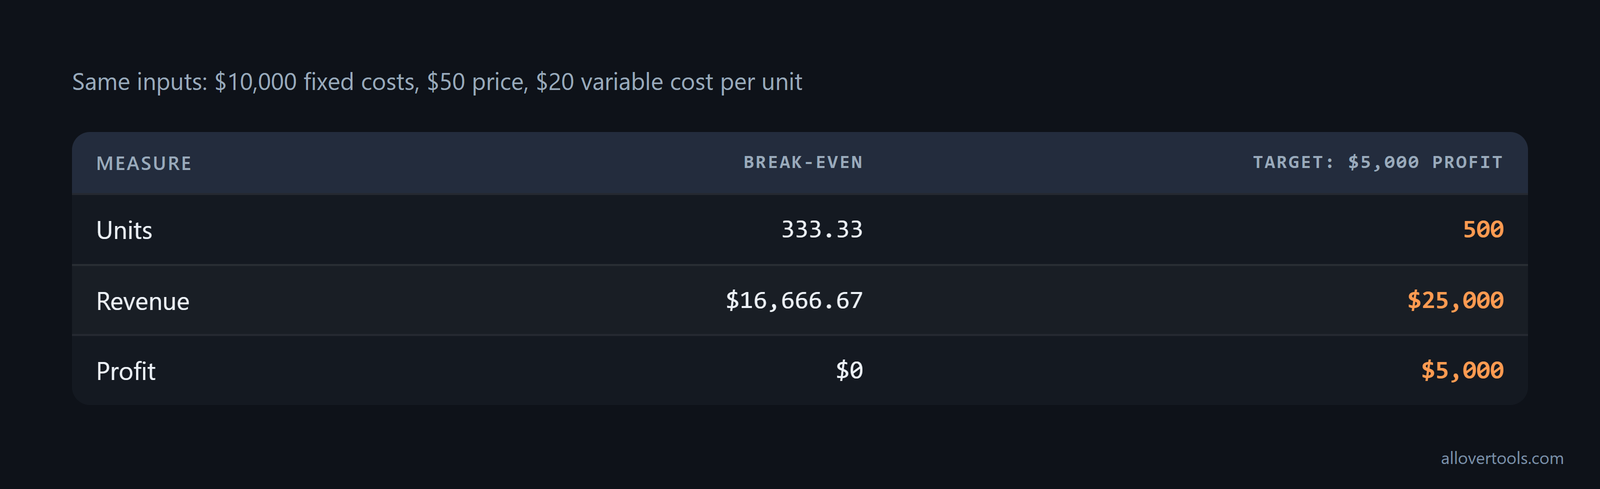
Break-even gives the sales level at zero profit. The target-profit result gives the sales level for the chosen $5,000 profit under the same inputs.
Use the result as a sales decision
Compare expected sales with both thresholds. Fewer than 333.33 units leaves a loss under these inputs. Sales between that level and 500 units cover costs but do not reach the chosen $5,000 target. If 500 units is not realistic, change the fixed costs, price, or variable cost and calculate again rather than treating the threshold as a demand forecast.
For another check, use the Business Profit Calculator. Choose the visitor-facing "Break-even units & revenue" option, enter the same inputs, and select "Calculate". It shows the formula and assumptions but has no target-profit field, so the target-profit result still comes from the formula above.
How a price change moves the break-even point
Keep fixed costs at $10,000 and variable cost at $20 per unit. Then raise the chosen price from $50 to $60. The change affects the contribution from each sale.
A higher price with the same variable cost
Original price: $50
Original contribution margin: $50 - $20 = $30
Original contribution margin ratio: $30 / $50 = 60%
Original break-even: $10,000 / $30 = 333.33 units
Original break-even revenue: 333.333... x $50 = $16,666.67

New price: $60
New contribution margin: $60 - $20 = $40
New contribution margin ratio: $40 / $60 = 66.666...%
New break-even: $10,000 / $40 = 250 units
New break-even revenue: 250 x $60 = $15,000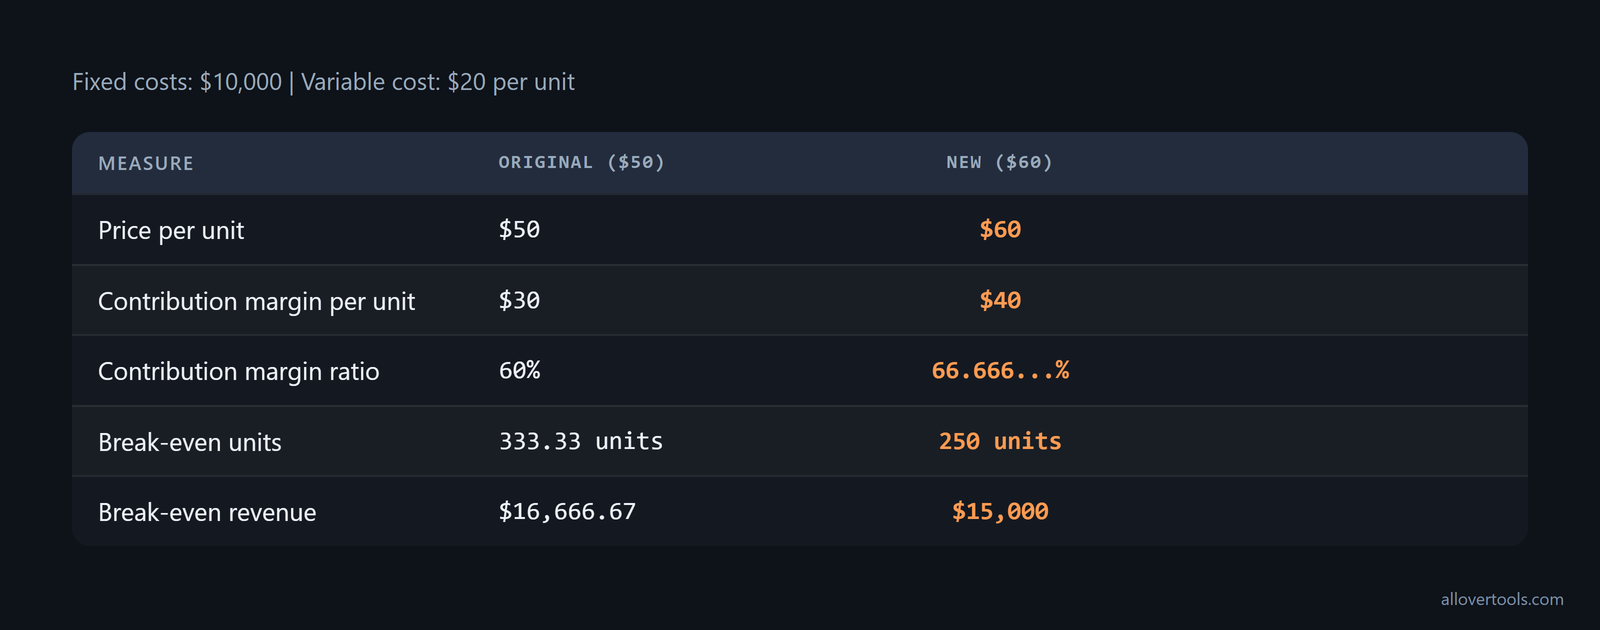
With these inputs, the higher price cuts the required volume from 333.33 units to 250 and lowers break-even revenue from $16,666.67 to $15,000. The difference comes from the extra contribution per sale, not from a change in fixed costs.
In practice, demand, discounts, product mix, and variable costs may change when the price changes. Those effects are outside these calculator inputs. Rerun the calculation when the cost, price, or sales pattern changes. The Markup Calculator can help relate cost, selling price, markup, and margin before a price is chosen.
Using break-even in planning and avoiding bad assumptions
Use break-even for a specific period. It can set a minimum sales volume, check whether a proposed price covers fixed costs, compare a profit target with expected demand, and show what changes when a cost or price assumption is updated.
Planning questions the calculation can answer
- How many units cover the fixed costs for this period?
- What revenue corresponds to that unit volume?
- How many units reach the chosen profit target?
- How does a price or cost change alter the threshold?
Keep each answer tied to the same period. Monthly fixed costs and monthly sales belong together. The unit price and variable cost must describe the same sale.
Common break-even assumption errors
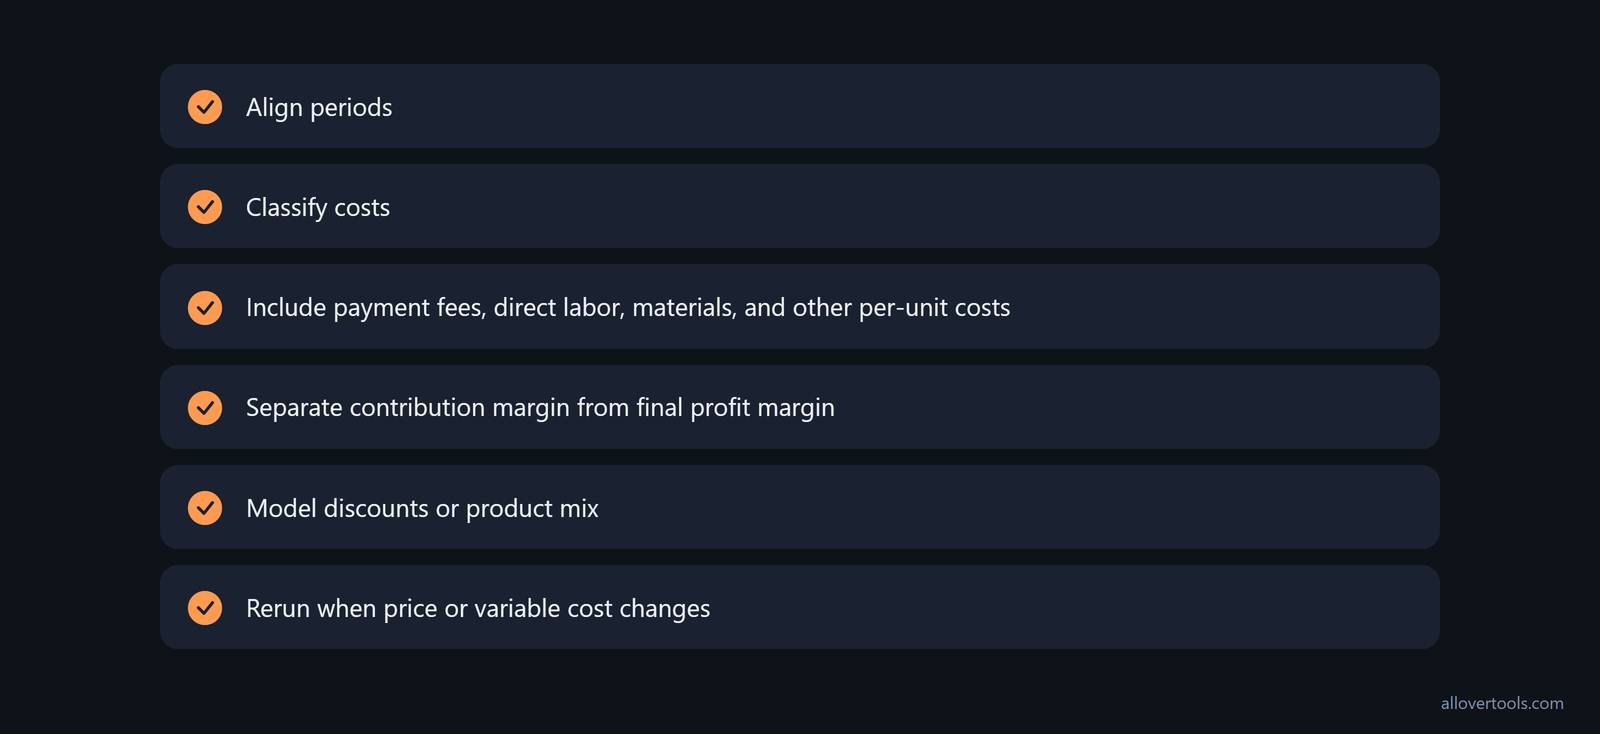
- Mixing periods creates a mismatched threshold. Pair monthly fixed costs with monthly sales, or align the figures to another period before calculating.
- Treating every cost as fixed or every cost as variable removes the behavior the formula needs. Classify each cost by whether it changes with units sold.
- Leaving out payment fees, direct labor, materials, or another per-unit cost makes the variable cost too low. Include each relevant cost that applies to a sale.
- Contribution margin covers fixed costs first, so it is not the same as final profit margin. Keep the two measures separate.
- A single price may not describe sales with discounts or a different product mix. Model the relevant mix or discount and calculate again.
- Price or variable cost may change at a higher volume. Rerun the calculation for the new assumption instead of extending the old threshold.
When variable cost per unit is equal to or above price, each sale contributes zero or a loss before fixed costs. Break-even is a decision aid based on entered assumptions, not a demand forecast or a guarantee of profit.
Frequently asked questions
How do I calculate break-even and profit together?
Profit equals revenue minus fixed and variable costs. Break-even units = fixed costs / (price - variable cost). Target-profit units = (fixed costs + target profit) / (price - variable cost). The first result gives zero profit; the second gives the chosen profit under the same assumptions.
What sales revenue is needed to make a target profit?
Calculate target units as (fixed costs + target profit) / contribution margin per unit, then calculate target revenue as target units x price per unit. Units come first because revenue depends on the price assumption.
Is contribution margin the same as profit margin?
No. Contribution margin per unit is price minus variable cost and helps cover fixed costs. Profit margin measures profit after the relevant costs have been deducted from revenue. The contribution margin ratio is therefore not automatically the final profit margin.
What happens to break-even when the selling price increases?
If fixed costs and variable cost per unit stay constant, a higher price increases contribution margin and lowers the units needed to break even. Demand, discounts, and variable costs can change the actual result, so rerun the inputs when those figures change.
Why is break-even not the same as a profit target?
Break-even is where revenue equals total costs and profit is zero. A profit target adds the desired profit to fixed costs before dividing by contribution margin, which produces a higher sales threshold.