Business profit cash flow is easier to understand when two events stay separate: revenue earned and cash collected. Profit compares recognized revenue with recognized costs for a period. Cash flow tracks money that actually comes in and goes out. A business can show a profit while unpaid invoices, inventory purchases, and loan principal leave too little cash for the next payment.
Profit and cash flow answer different questions
What profit measures
Profit is an accrual accounting result. It puts revenue and costs in the period they belong to, even when the related cash arrives or leaves later. The basic relationship is:
Profit = Revenue - COGS - operating expenses - applicable interest and tax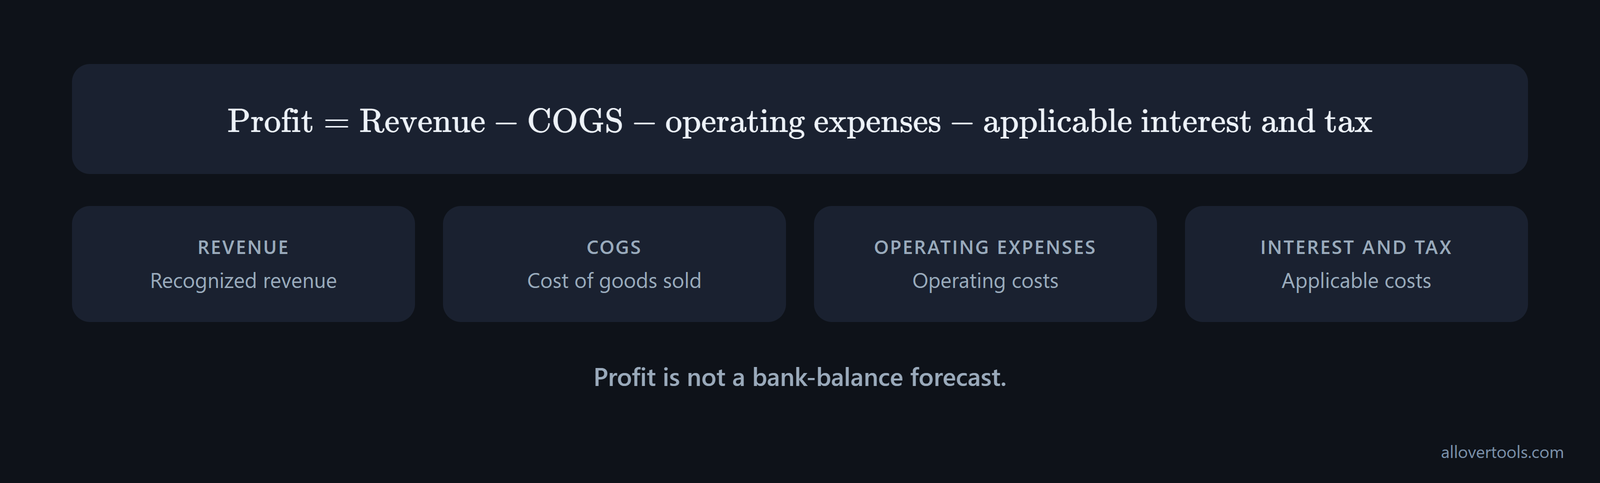
The period label, such as Monthly, tells you which reporting window the figures describe. Earning revenue is not the same as collecting the invoice. If a customer still owes the business money at period end, the revenue can increase profit while the cash remains in accounts receivable.
An income statement shows this accrual view. It reports revenue, cost of goods sold (COGS), operating costs, interest, and the resulting profit for the period. That result can leave out unpaid invoices, cash tied up in inventory, and debt principal due soon. Profit is not a bank-balance forecast.
Before comparing profit with the bank balance, check which accounting basis is being used. With cash accounting, income is recorded when cash is collected and expenses when cash is paid. With accrual accounting, income is recorded when earned and expenses when incurred, so they fall in the period they belong to, as the accounting comparison explains. Under pure cash accounting, period profit tracks operating cash changes fairly closely before financing and investing. Accrual profit can differ because of receivables, payables, inventory changes, and non-cash items.
Some entries lower profit without an immediate cash payment. Depreciation, amortization, and stock-based compensation are examples of non-cash items that affect profit but do not create cash outflows, according to this profit guide. Keep them in the reconciliation so a low or negative profit figure is not mistaken for the exact amount of operating cash available.
What cash flow measures
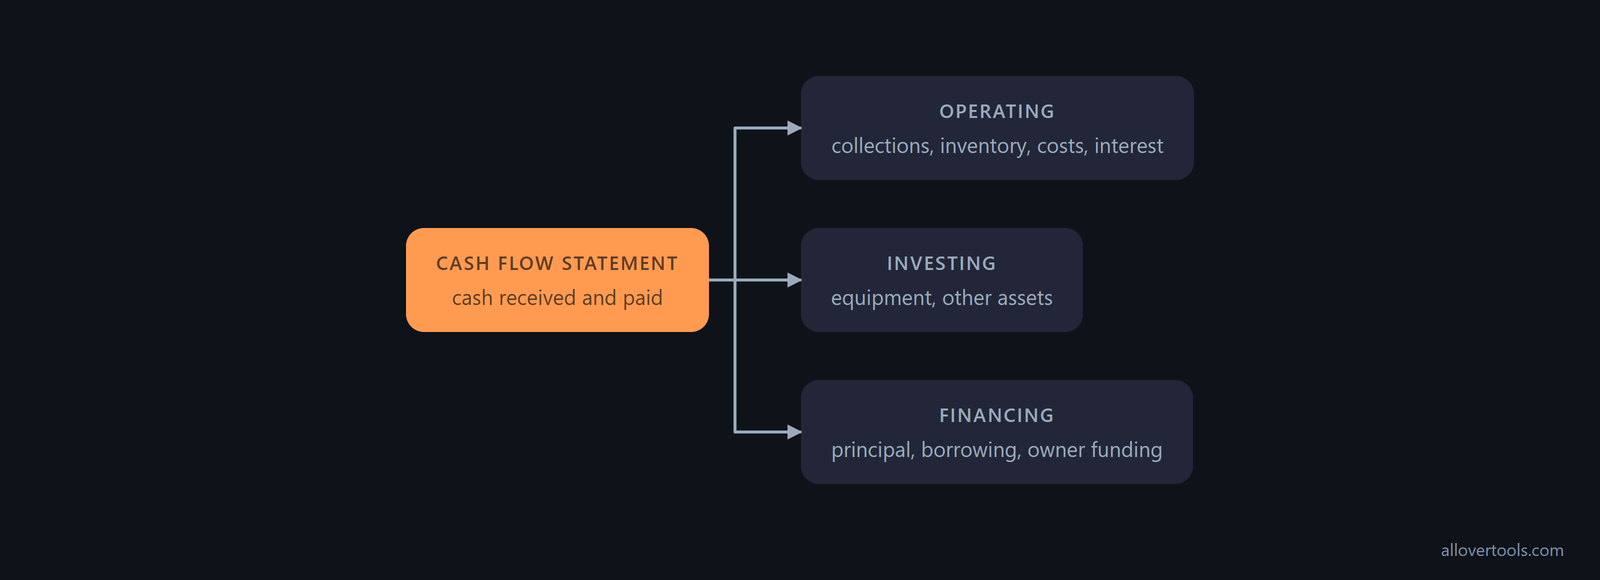
Cash flow records cash received and paid during the period. Customer collections, inventory payments, operating payments, and interest affect operating cash. Loan principal is a financing cash movement. Equipment or other asset purchases are investing cash movements. New borrowing or owner funding are financing cash movements.
A cash flow statement groups these changes into operating, investing, and financing activity. A period can have positive profit and a negative cash change. Profit shows the period's economics; cash flow shows when money is available to pay obligations.
Where profit and cash move out of sync
Invoices: revenue earned before cash collected
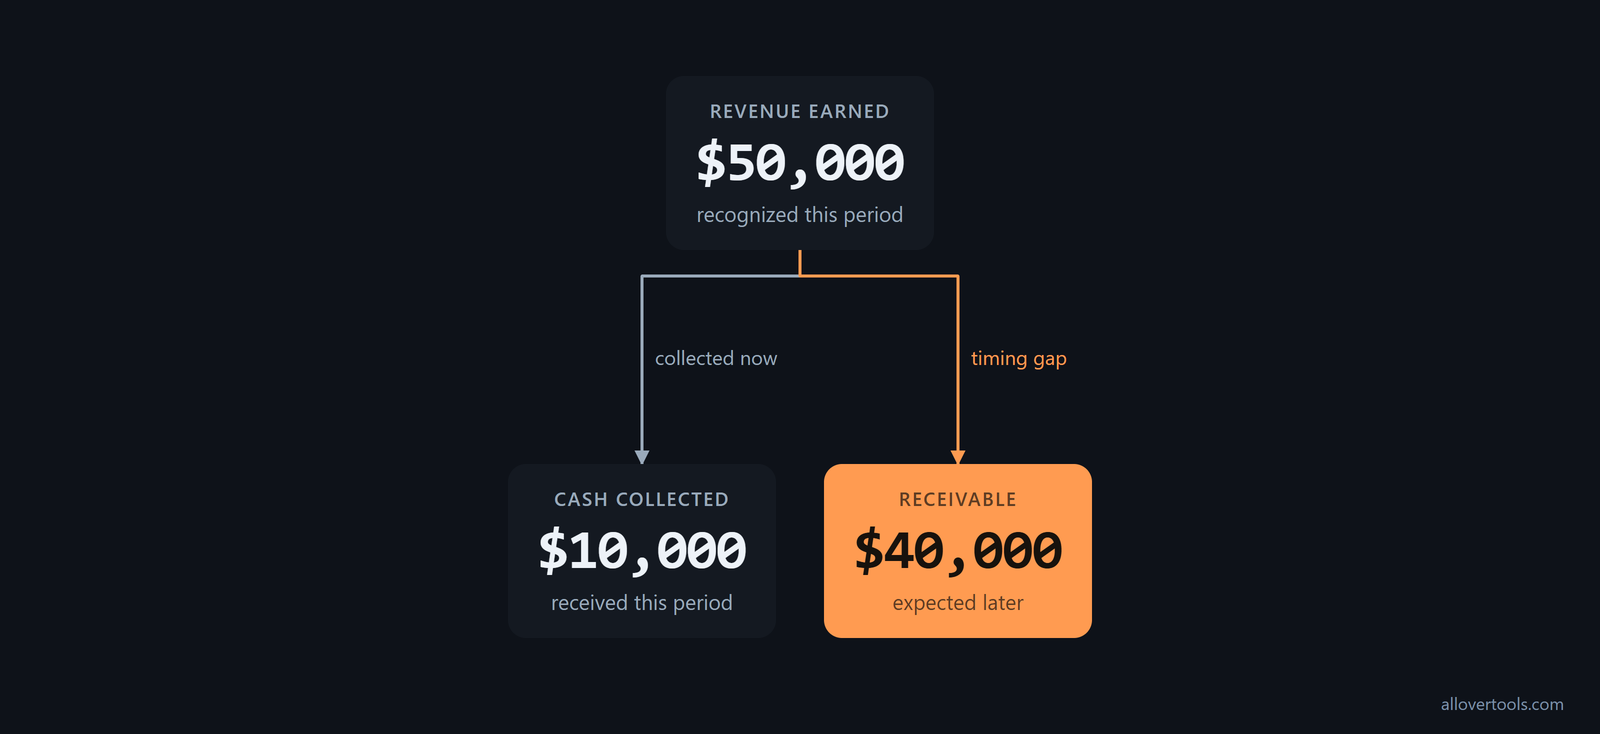
Use these chosen illustrative values: the business recognizes $50,000 of revenue, but customers pay only $10,000 during the period.
Revenue recognized: $50,000
Cash collected:     $10,000
Receivables timing gap: $50,000 - $10,000 = $40,000
The remaining $40,000 is a receivable. Profit can rise when the revenue is recognized while the bank balance waits for collection. A cash projection should put the $10,000 on its expected receipt date and put the remaining invoices in the months when customers are expected to pay. An invoice total does not tell you when the cash will arrive.
Inventory: cash paid before the cost is recognized
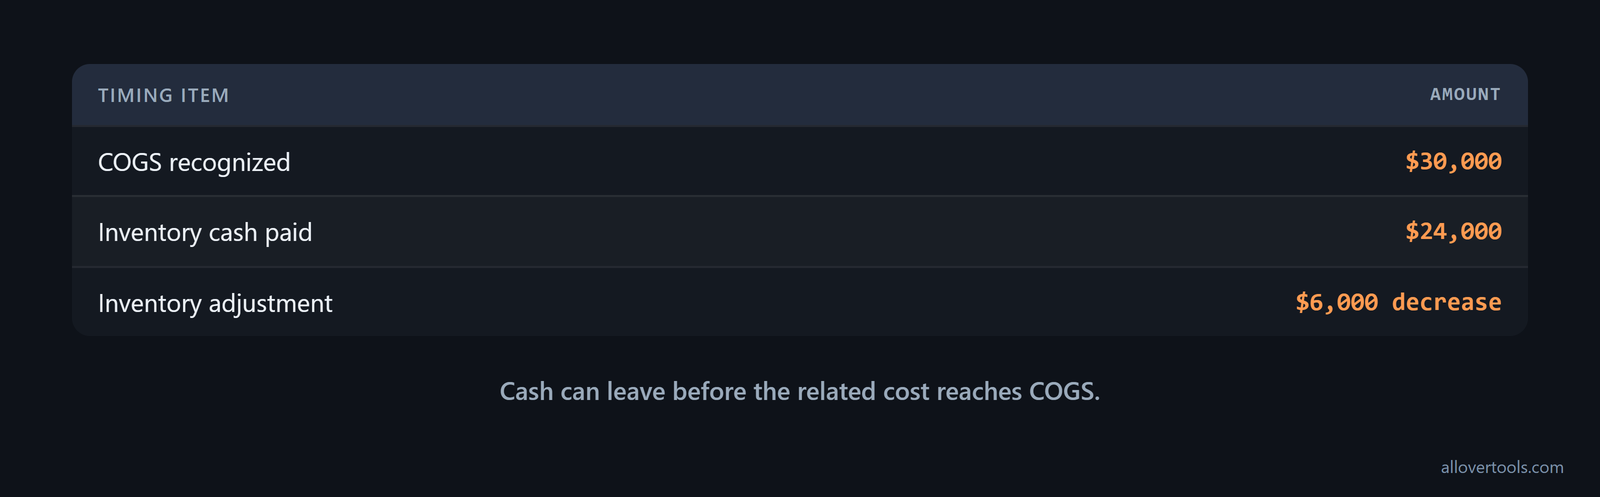
Inventory creates another timing difference. In this chosen scenario, the business pays $24,000 for inventory, while $30,000 of inventory cost reaches COGS as the related goods are sold.
COGS recognized:       $30,000
Inventory cash paid:   $24,000
Inventory adjustment:  $30,000 - $24,000 = $6,000 decrease
The purchase uses cash when the stock is bought. COGS follows the inventory sold, so the two amounts can fall in different periods. Stock bought for future sales can create a cash squeeze while the income statement still shows a profit.
Loan principal and interest are not the same
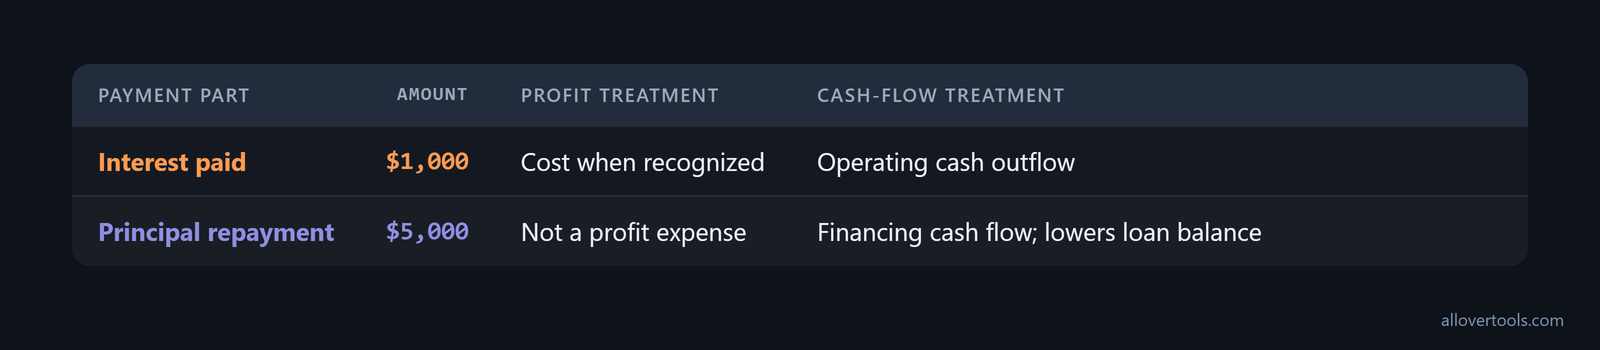
A loan payment has separate parts. In this chosen example, $1,000 is interest and $5,000 is principal.
Interest paid:           $1,000
Principal repayment:     $5,000
Interest is a cost in profit when it is recognized. Principal repayment reduces cash and the outstanding loan balance, but it is not a profit expense. Keep principal in financing cash flow instead of burying it in operating profit.
To reconcile the two measures, start with profit and adjust for receivables, inventory, and other non-cash or timing items until you reach operating cash flow. Then show principal and other investing or financing movements separately. Exact treatment depends on the accounting records and payment timing, so these values are illustrative rather than a tax or accounting determination.
If receivables, stock, supplier credit, or loans make the simple example hard to follow, use a fuller bridge. The reconciliation rule is:
Net Profit + Depreciation - Increases (or + Decreases) in Accounts Receivable - Increases (or + Decreases) in Inventories + Increases (or - Decreases) in Accounts Payable - Decreases (or + Increases) in Notes Payable (Bank Loans).
The bridge shows which way each adjustment moves cash. Add back depreciation because it is a non-cash expense. Increases in receivables and inventories reduce cash, while increases in accounts payable increase it. A decrease in notes payable reduces cash. Use the loan balance and working-capital movements for the period being reconciled; the bank balance is not a substitute for the calculation.
A business with heavy debt can report strong earnings and still have little liquidity for other needs. This debt example describes a company using every dollar of free cash to pay down debt and cover expenses. Interest appears on the income statement, but principal repayments drain cash without reducing profit. Put principal payments on the financing side of the cash projection and check the debt schedule before treating profit as cash available to spend.
When profit is positive but cash is tight, look at where the cash went, not only at receivables and inventory:
- Cash can be tied up in accounts receivable when customers have not paid their invoices.
- Cash can sit in inventory before the related cost reaches the income statement.
- A recent equipment purchase uses cash without appearing as a current-period operating expense.
- Aggressive debt-principal repayment reduces cash and the loan balance without reducing profit.
- Owner withdrawals take cash out of the business without being a current-period operating expense.
- A tax payment can use cash even when it is not part of the current-period operating outflow being reviewed.
- Heavy investment in growth can consume cash while the business still reports positive net income.
A practical cash-poor breakdown uses this broader diagnostic. It fits a business that is investing or paying down obligations faster than cash comes in. In that situation, check the balance sheet and cash-flow statement instead of relying on profit alone.
Worked example: a profitable business with only $3,000 cash
Calculate the selected period's profit
All figures in this example are chosen illustrative values. In the Business Profit Calculator, choose Net profit margin for Calculation mode and Monthly for Period. Enter Revenue of $50,000, Cost of goods sold (COGS) of $30,000, and Operating expenses / overhead of $13,000. Leave Estimated tax rate % (optional) blank, which makes tax 0%.
The $13,000 input combines the selected $12,000 operating costs and $1,000 interest. The calculator has one operating-expense field, so interest is not entered separately.
Gross profit = $50,000 - $30,000 = $20,000
Operating profit = $20,000 - $13,000 = $7,000
Estimated tax = $7,000 x 0% = $0
Net profit = $7,000 - $0 = $7,000
Net margin = $7,000 / $50,000 x 100 = 14%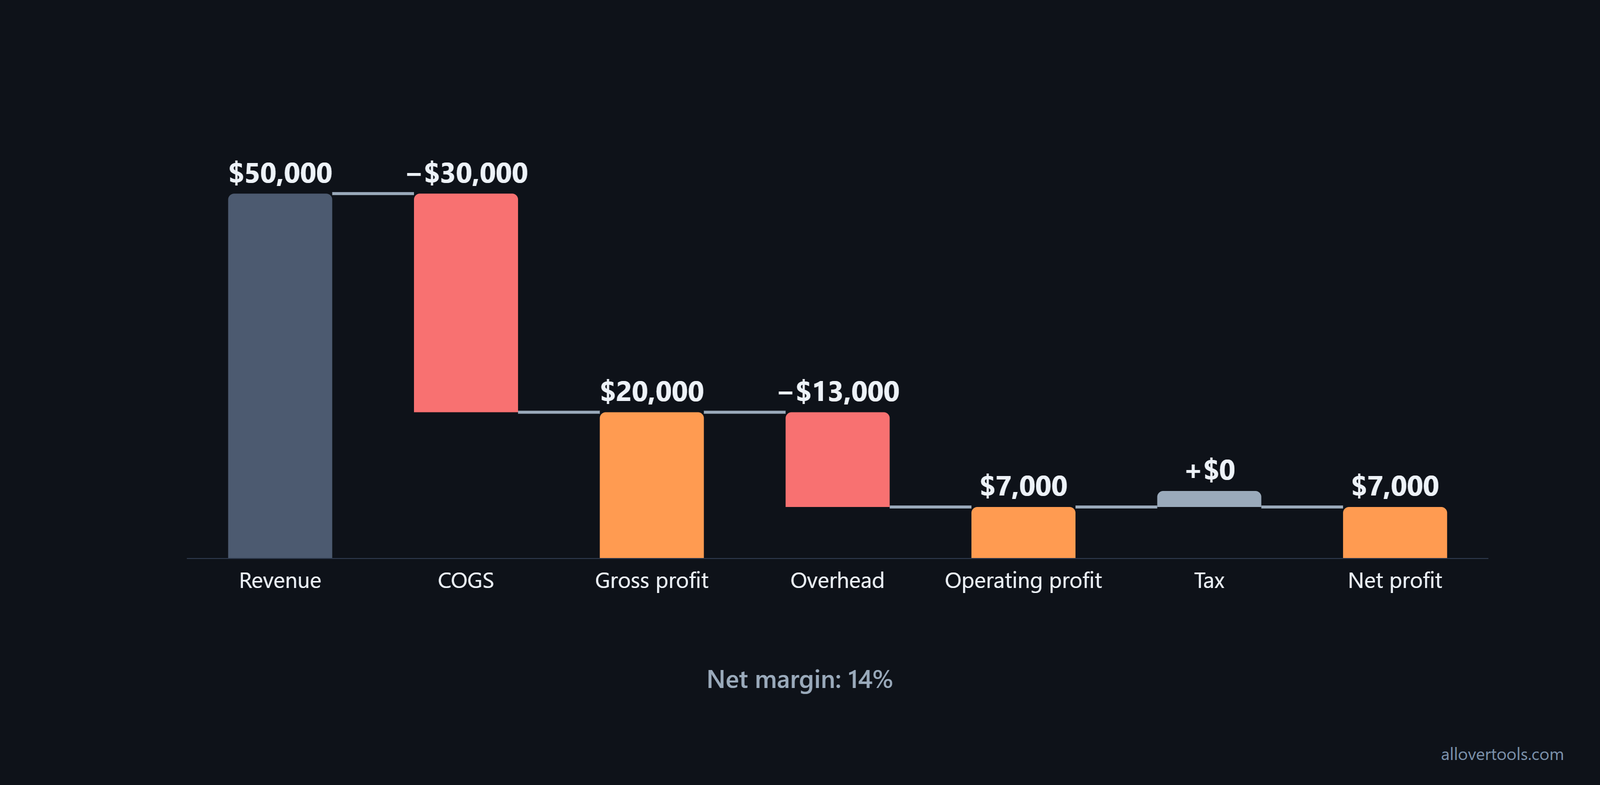
The result is $20,000 gross profit, $7,000 operating profit, $7,000 net profit, and a 14% net margin. This is the income-statement side of the comparison, not the amount of cash available.
Reconcile profit to the cash balance
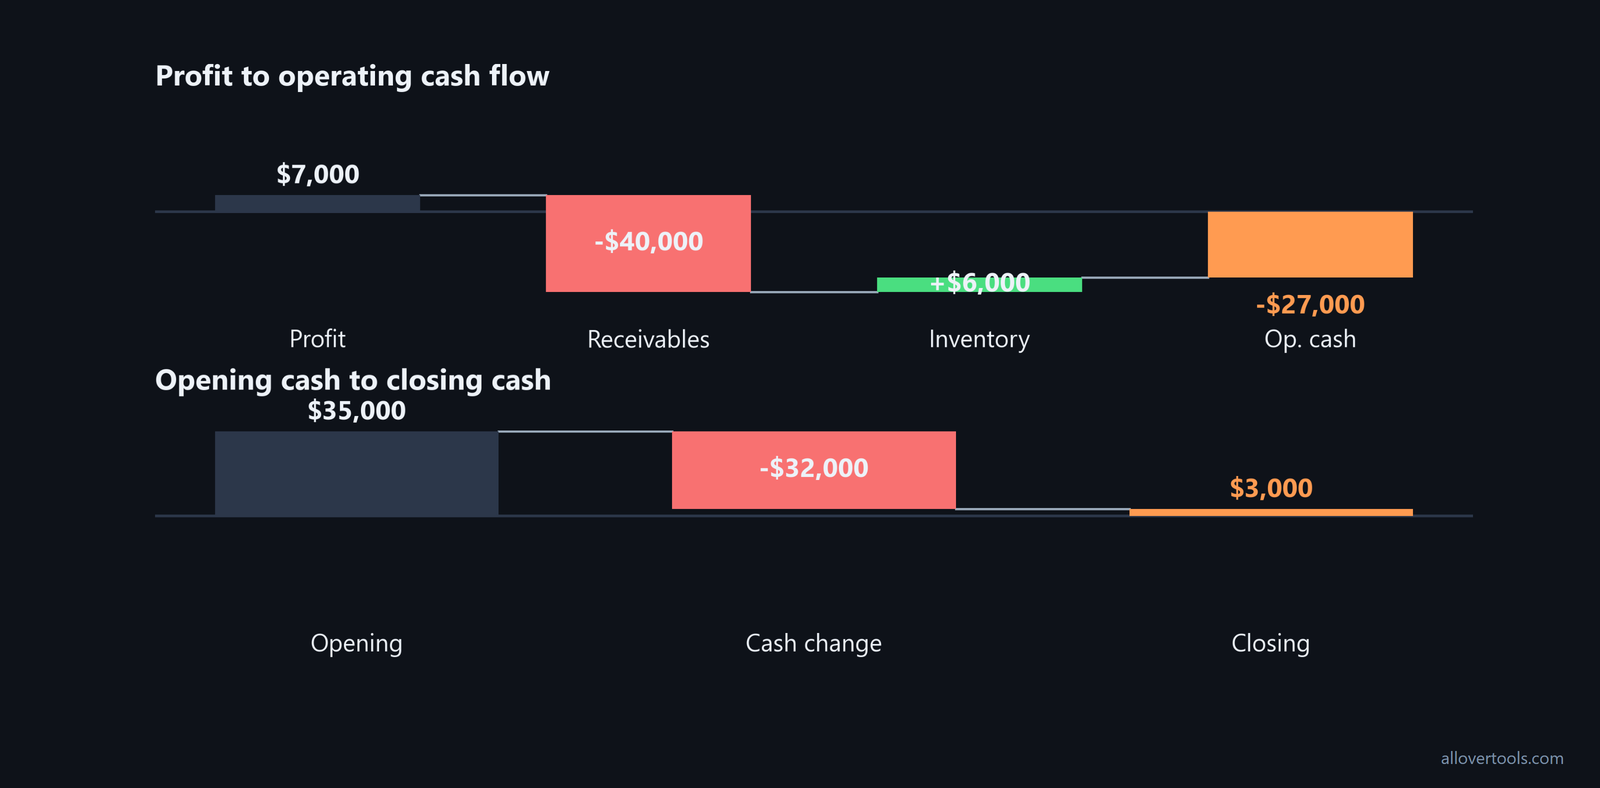
For the same chosen scenario, opening cash is $35,000. Customers pay $10,000, inventory costs $24,000, operating costs are $12,000, interest is $1,000, and principal repayment is $5,000.
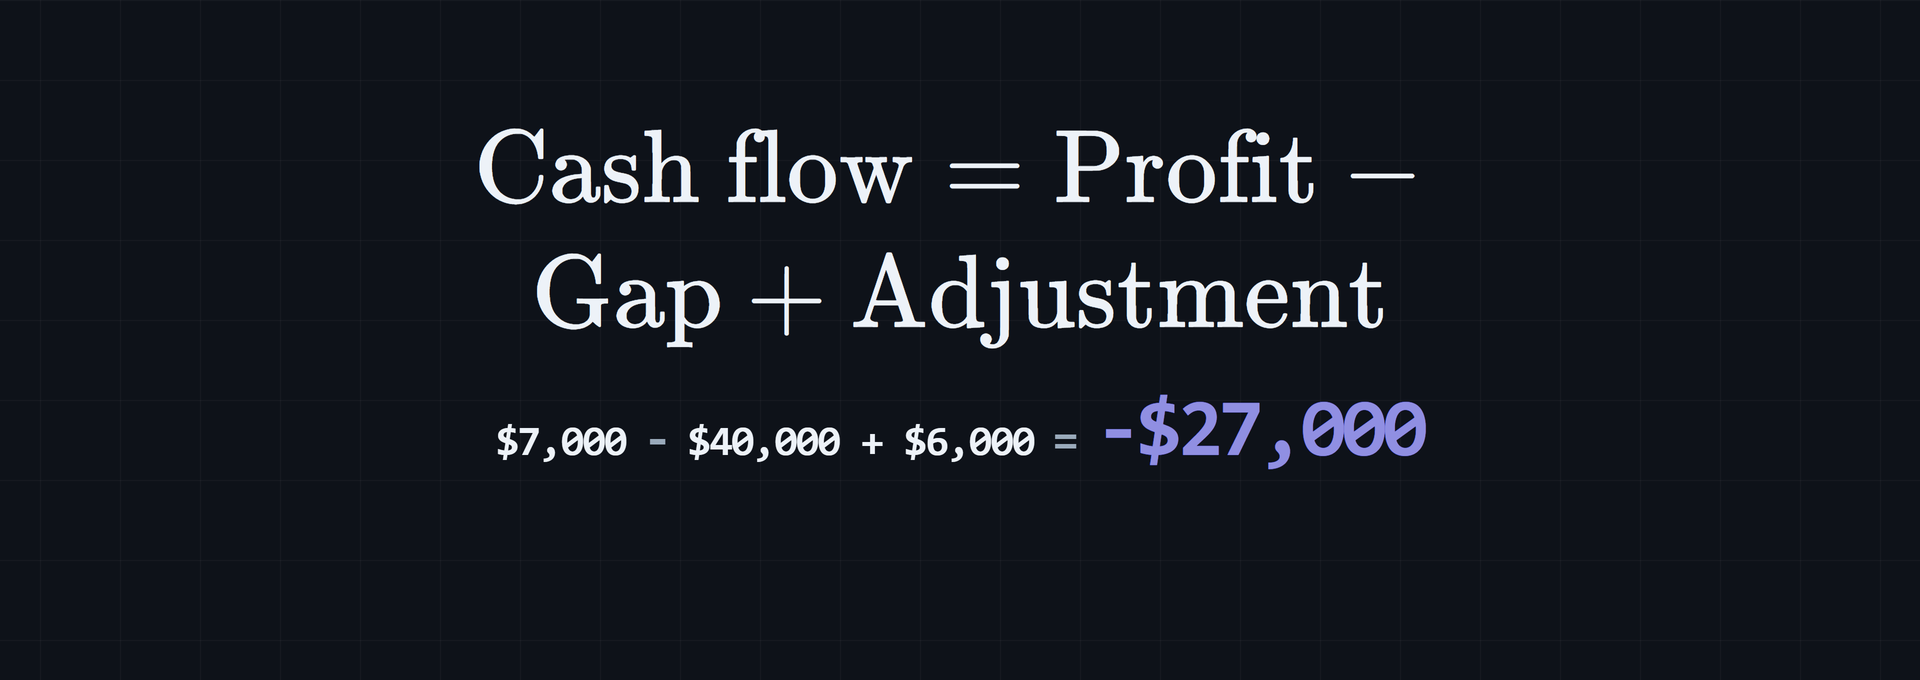
Operating cash flow = $10,000 - $24,000 - $12,000 - $1,000
                   = -$27,000

Total cash change = -$27,000 - $5,000 principal
                  = -$32,000

Closing cash = $35,000 - $32,000
             = $3,000
The reconciliation from $7,000 profit to -$27,000 operating cash flow is:
Profit                         $7,000
Less: receivables timing gap  -$40,000
Add: inventory decrease         $6,000
Operating cash flow           -$27,000
The $40,000 adjustment is revenue recognized before collection. The $6,000 inventory adjustment is the difference between $24,000 paid for stock and $30,000 of COGS recognized. After the separate $5,000 principal payment, the business has only $3,000 cash despite the $7,000 profit. The calculators use entered values in the browser. Their code does not send those values in a network request, so the tools are not connected to a bank or accounting system.
Use burn rate and runway to see near-term cash risk
Read burn rate beside profit
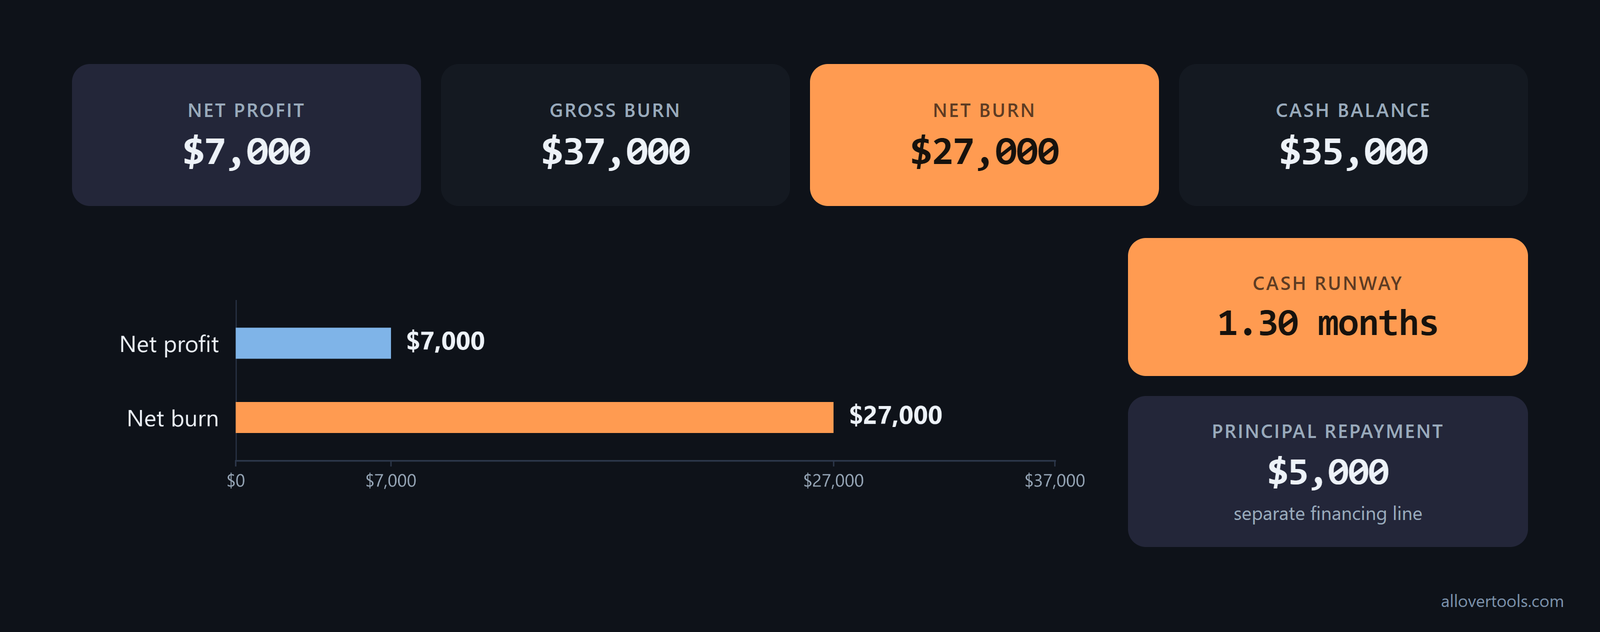
Profit answers whether the period is profitable. Burn rate and runway show how quickly available cash is being used. In the Burn Rate Calculator, enter Current cash balance of $35,000, choose Monthly (12 periods/year), enter Revenue for this period of $10,000 and Total expenses for this period of $37,000, then select Calculate burn rate.
Gross burn = Monthly expenses = $37,000
Net burn = Monthly expenses - Monthly revenue
         = $37,000 - $10,000 = $27,000
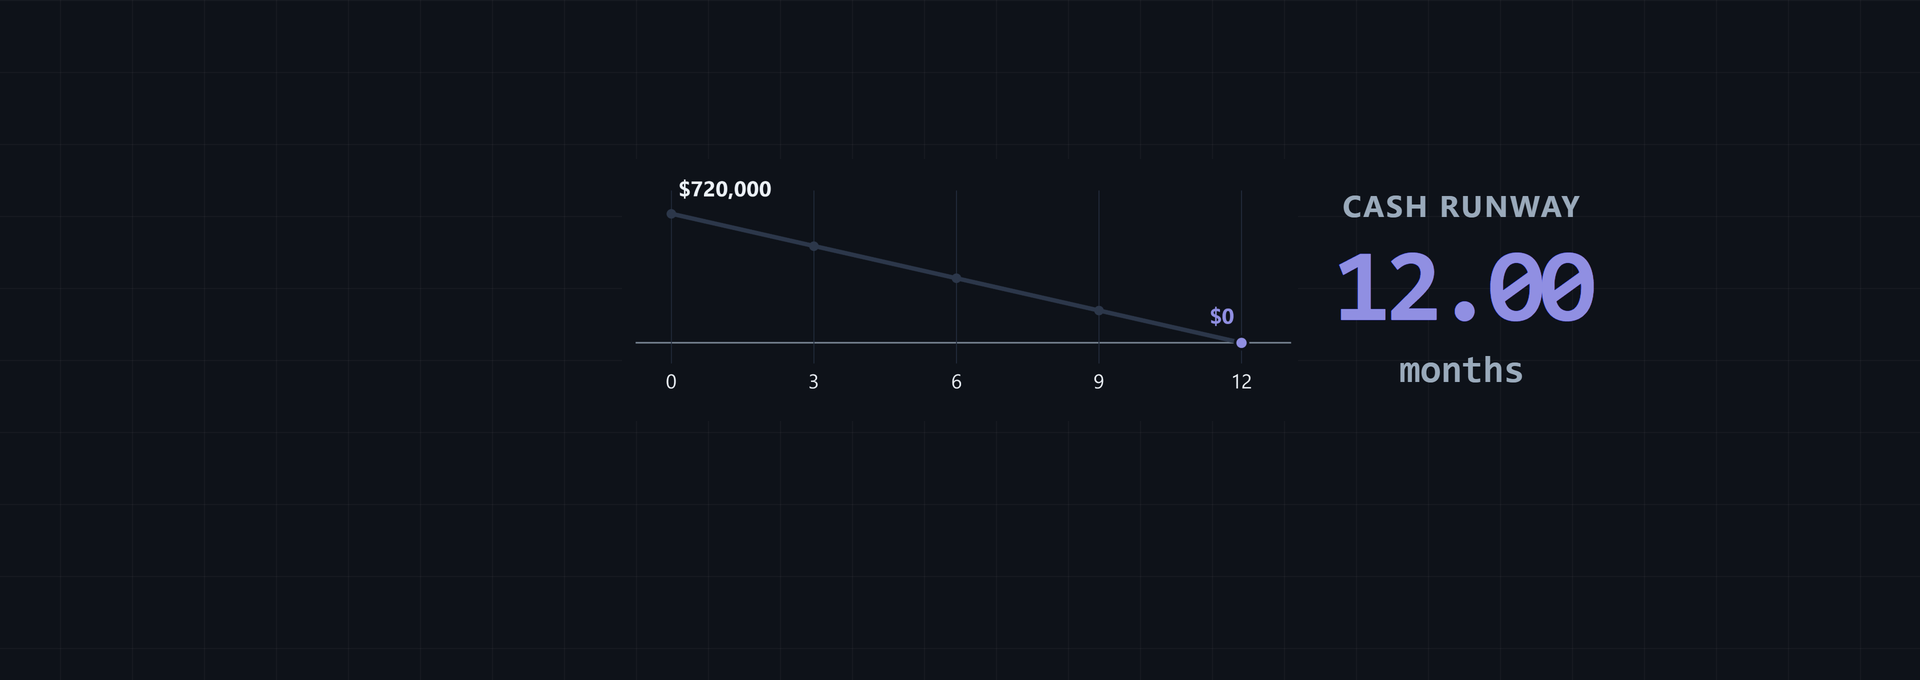
Cash runway = Cash balance / Net burn
            = $35,000 / $27,000 = 1.30 months
The $37,000 cash operating outflow is $24,000 for inventory, $12,000 for operating costs, and $1,000 for interest. The $5,000 principal repayment stays on its own financing line. A $27,000 net burn beside a $7,000 profit shows why runway is not a profit measure.
Project when cash reaches zero
For the month-by-month view, use the Cash Runway Calculator with Current cash balance of $35,000, Monthly revenue (month 1) of $10,000, and Monthly expenses / burn (month 1) of $37,000. Leave Monthly revenue growth rate (optional) and Monthly expense growth rate (optional) blank, then select Calculate runway and inspect the projection table.
Blank growth fields keep the monthly values unchanged. For month m, net burn equals expenses minus revenue, and ending cash equals prior cash minus net burn.
Month 1 ending cash = $35,000 - $27,000 = $8,000
Month 2 ending cash = $8,000 - $27,000 = -$19,000
First depletion: month 2
Interpolated runway = 1 + ($8,000 / $27,000) = 1.30 months
This is a cash projection from the supplied monthly revenue and expenses, not an accrual profit statement. It excludes the separate principal repayment unless that payment is included in the expense input or added separately.
Build a basic cash flow projection and adjust decisions
When reported profit does not match the cash position, pull the reports together before changing the forecast. A practical diagnostic checklist recommends reviewing:
- Check the profit and loss statement to confirm whether the business shows enough profit.
- Scan the balance sheet for cash absorbed into receivables, inventory, equipment, debt reduction, and owner equity.
- Review accounts receivable aging to see how old the unpaid invoices are.
- Use the cash-flow statement to see whether cash is going to operating, investing, or financing activity.
- Separate principal from interest in the debt schedules.
- Compare owner draws or distributions with sustainable levels.
- Check the tax reserves to make sure cash has been set aside.
- Map upcoming payroll, rent, insurance, inventory, equipment, and tax payments.
Set up the monthly cash flow rows
Use one worksheet for the monthly view. Put the rows in this order:
- Opening cash.
- Customer cash collected by expected receipt month.
- Inventory purchases paid in the month.
- Cash operating costs.
- Interest paid.
- Principal repayments.
- Other investing or financing cash.
- Closing cash.
Calculate closing cash as:
Closing cash = Opening cash + cash inflows - cash outflows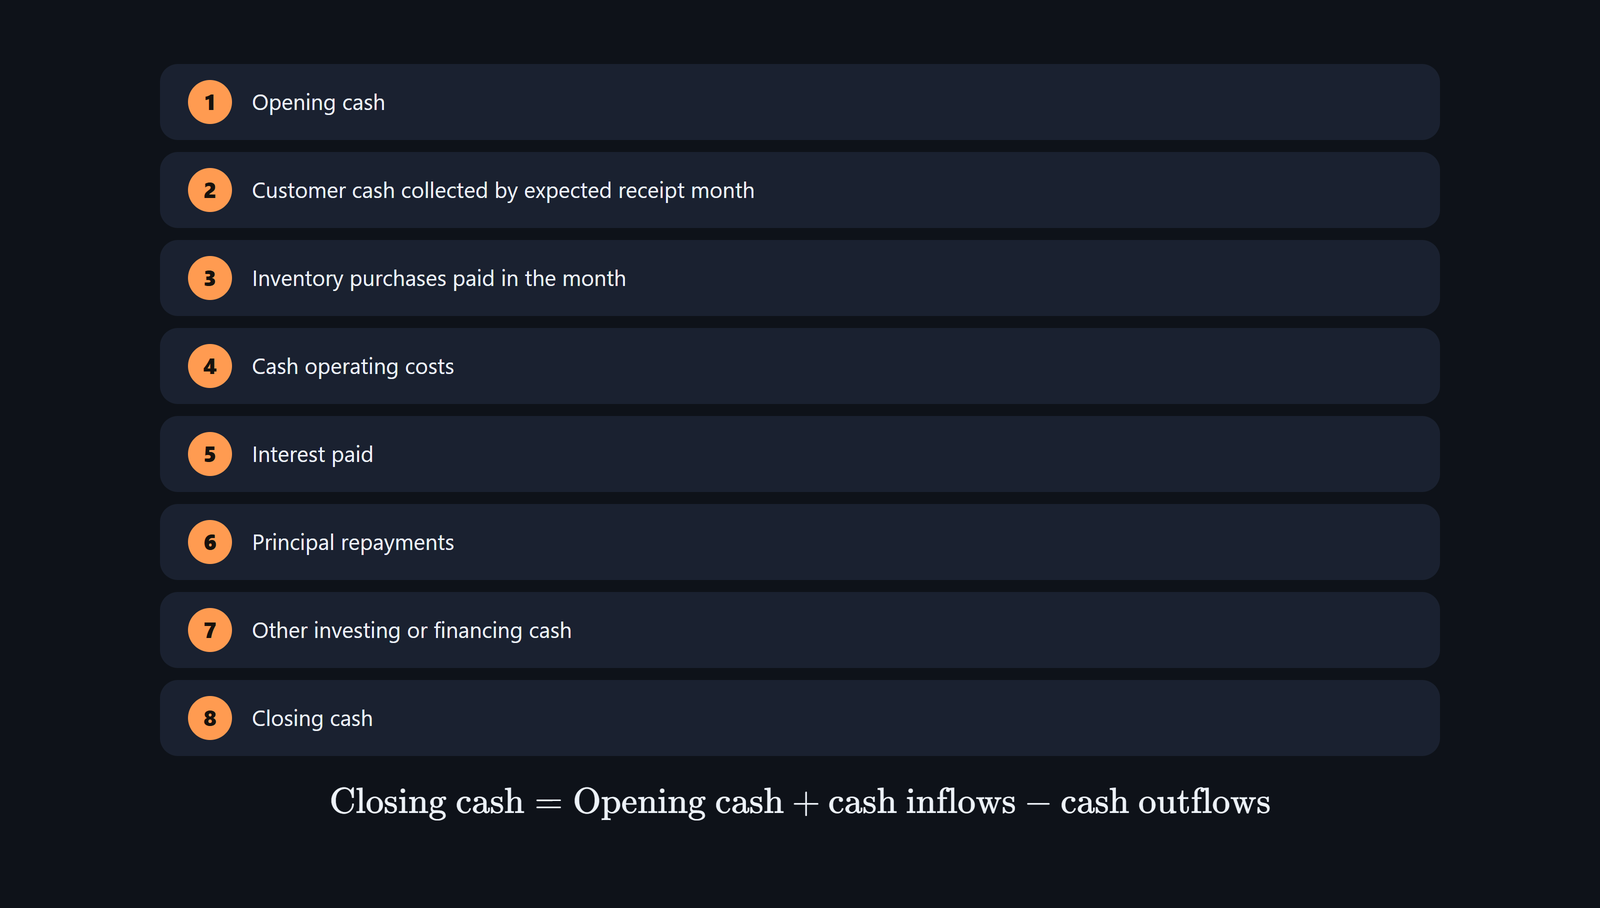
Carry each closing balance into the next month's opening cash. Write an assumption beside each line, such as the expected invoice receipt date, inventory payment date, or debt payment date. Update it when the expected collection or payment changes.
Keep invoice collections, inventory purchases, and loan principal separate. This exposes timing that profit misses and stops a principal payment from disappearing inside an operating-cost total.
Use both metrics for the next decision
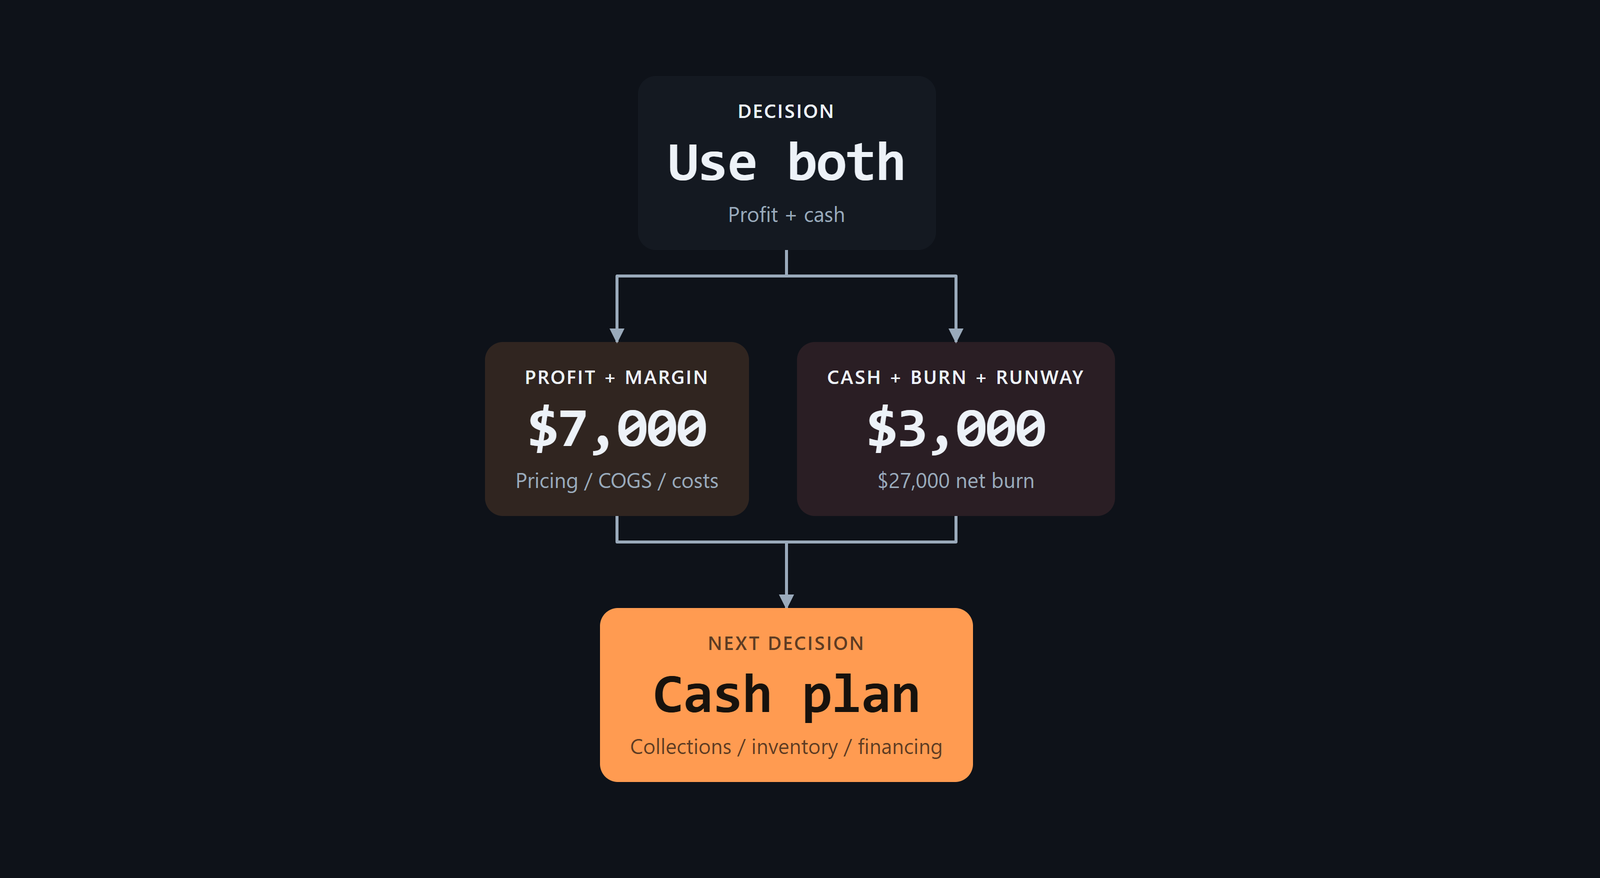
Use profit and margin to review pricing, COGS, and operating costs. Use cash flow, burn, and runway to prioritize collections, pace inventory purchases, schedule principal payments, and protect a cash buffer.
Choose the metric that fits the time horizon. Cash flow usually matters more for short-term obligations such as payroll, taxes, inventory, and operating costs. Profit matters for long-term success. The short-term comparison supports focusing on liquidity now without treating a lack of profit as harmless. Over time, persistent lack of profit also damages cash flow.
Read the gap in light of the business stage. The stage comparison points to two valid patterns:
- A company can report a profit and still have negative cash flow if it is investing in expansion or collections are behind sales.
- A company can have positive cash flow and rising sales but still make no profit when operating costs and growth investments exceed revenue, as happens with many startups and scaling businesses.
In this chosen scenario, $7,000 net profit does not make $3,000 closing cash and $27,000 monthly net burn safe. The next decision needs a collection, inventory, or financing plan. A flat monthly projection also omits seasonality, one-time charges, financing events, and later changes unless you enter them as separate assumptions. Profit alone cannot show when cash runs out.
If the projection shows a squeeze, respond to the line causing it. The options include:
- Collect receivables faster and follow up on overdue balances.
- Require deposits or change payment terms so cash arrives earlier.
- Build a short-term cash forecast before committing to new spending.
- Create separate reserves for taxes and major obligations.
- Set a consistent owner-pay or distribution policy.
- Review the debt structure and large principal payments.
- Slow or sequence growth investments when working capital is tight.
The cash-improvement playbook lays out these actions. Match the response to the shortfall: collections for receivables, terms or deposits for future invoices, reserves for known obligations, debt review for principal pressure, and slower growth spending when working capital cannot support the plan.
Frequently asked questions
Can a business be profitable and still run out of cash?
Yes. Profit can include revenue that customers have not paid yet, while inventory purchases and loan principal can consume cash before their related profit effects appear.
Does loan principal reduce business profit?
Principal repayment normally reduces cash and the outstanding loan balance, not profit. Interest is the financing cost that affects profit when recognized, so keep the two lines separate in a cash flow projection.
How do you reconcile profit with cash flow?
Start with profit, adjust for receivable and inventory timing plus other non-cash or accrual items to reach operating cash flow, then include principal and other investing or financing cash movements.
Should I track profit, burn rate, or cash runway?
Track all three for different questions: profit for period economics, burn rate for the pace of cash consumption, and runway for how long current cash can cover the modeled burn.