There's no single answer to what is a good cpc. Start by comparing your cost per click with the value each click can produce. CPC is total ad spend divided by total clicks for the same period or campaign. A low CPC means little if the resulting traffic doesn't create enough contribution.
What is a good CPC in context?
A CPC is good when it fits the value your clicks buy, so the basic math is simple: total ad spend over total clicks in a matching period or campaign. The math is plain.

Industry, keyword intent, competition, plus placement all affect the price. A broad query can reach someone still researching. A specific purchase query can bring someone close to action, so the two clicks shouldn't be judged by price alone, because you can expect different value from each click within the same campaign.

What does the click buy? That question ties the comparison to a useful action, because a cheap visit is no prize if it never helps during review. Keep spend and clicks within the same campaign scope and period. If clicks come from one interval while spend comes from another, the division may be correct even though the comparison is wrong; your report can still look precise.
For the base number, use the CPC Calculator. Its controls cover Currency and Period, then Total ad spend and Total clicks; Target CPC - optional is the last control. It reports CPC. It also shows implied cost per 1,000 clicks and total clicks for the period.
Target CPC - optional compares the entered target with the calculated result. It doesn't recommend a bid. Figures stay in the browser; no request sends them to a server.
Why CPC varies by industry and keyword
Industry and keyword affect CPC. Clicks can have different value. A broad, low-intent query can find someone gathering ideas, while a purchase-focused query may reach someone ready to act, so you need the purpose beside its price.
What is a reasonable cost per click? It depends on the action that matters to your business. The same price may fit one query and waste money on another, so start with that action instead of a universal threshold. Use your goal.
Product value changes how you read the same CPC. A $10 CPC may be excellent for a SaaS product with a $500 average contract value but unsustainable for an e-commerce product priced at $15. The example in this product contrast shows why. Compare CPC with the average contract or order value before calling the price reasonable.
How competition and ad placement change CPC
Competition for a query and the placement where an ad appears can both change what advertisers pay. Prominent placement may cost more. Averages move when placement mix changes.
Compare similar campaigns and query groups. CPC benchmarks by competition can mislead when one report mixes broad queries with specific ones or uses a different placement mix, so keep the comparison tidy.
The 2026 Google Ads benchmarks put the overall average at $5.42, but category averages run from $1.63 to $9.87. That range is why a headline average can't tell you whether a CPC is good; the 2026 benchmark report shows the spread.
| Category | Average CPC |
|---|---|
| Arts & Entertainment | $1.63 |
| Restaurants & Food | $2.05 |
| Attorneys & Legal Services | $9.87 |
| Home & Home Improvement | $8.33 |
| Dentists & Dental Services | $8.00 |
The spread matters: $5.42 isn't a target. Compare your CPC with intent, placement, margin, and downstream value before changing a bid.
Compare CPC with margin and average order value
Compare CPC with each order's contribution. The break-even CPC formula is average order value x conversion rate x contribution margin percentage.
That formula estimates contribution available per click before fixed costs and other excluded costs, so it gives you a ceiling, not a direct bid instruction. The conversion rate must use matching click and conversion definitions for that period.
CPC is only one part of the economics. Review it alongside conversion rate, customer lifetime value (CLV), and total customer acquisition cost (CAC), then compare the result with a target ROI. A commonly used rule of thumb is 5:1 ROI: every $1 spent on advertising generates $5 in revenue, according to this CPC guidance. A CPC can look acceptable on the first purchase and still fail when CLV is low or CAC is high relative to that target.
For repeat-purchase or subscription models, judge whether customer value recovers acquisition cost within the payback window. The first order breaking even is only part of the decision. A CPC can be acceptable when the first order is breakeven if the payback window, such as 6-12 months, fits the business's tolerance.
In 2025, common ranges such as $0.50, $3 for e-commerce and $10, $80+ for legal still don't answer that decision. The LTV and payback view puts CPA fit with LTV and payback math ahead of a low benchmark.
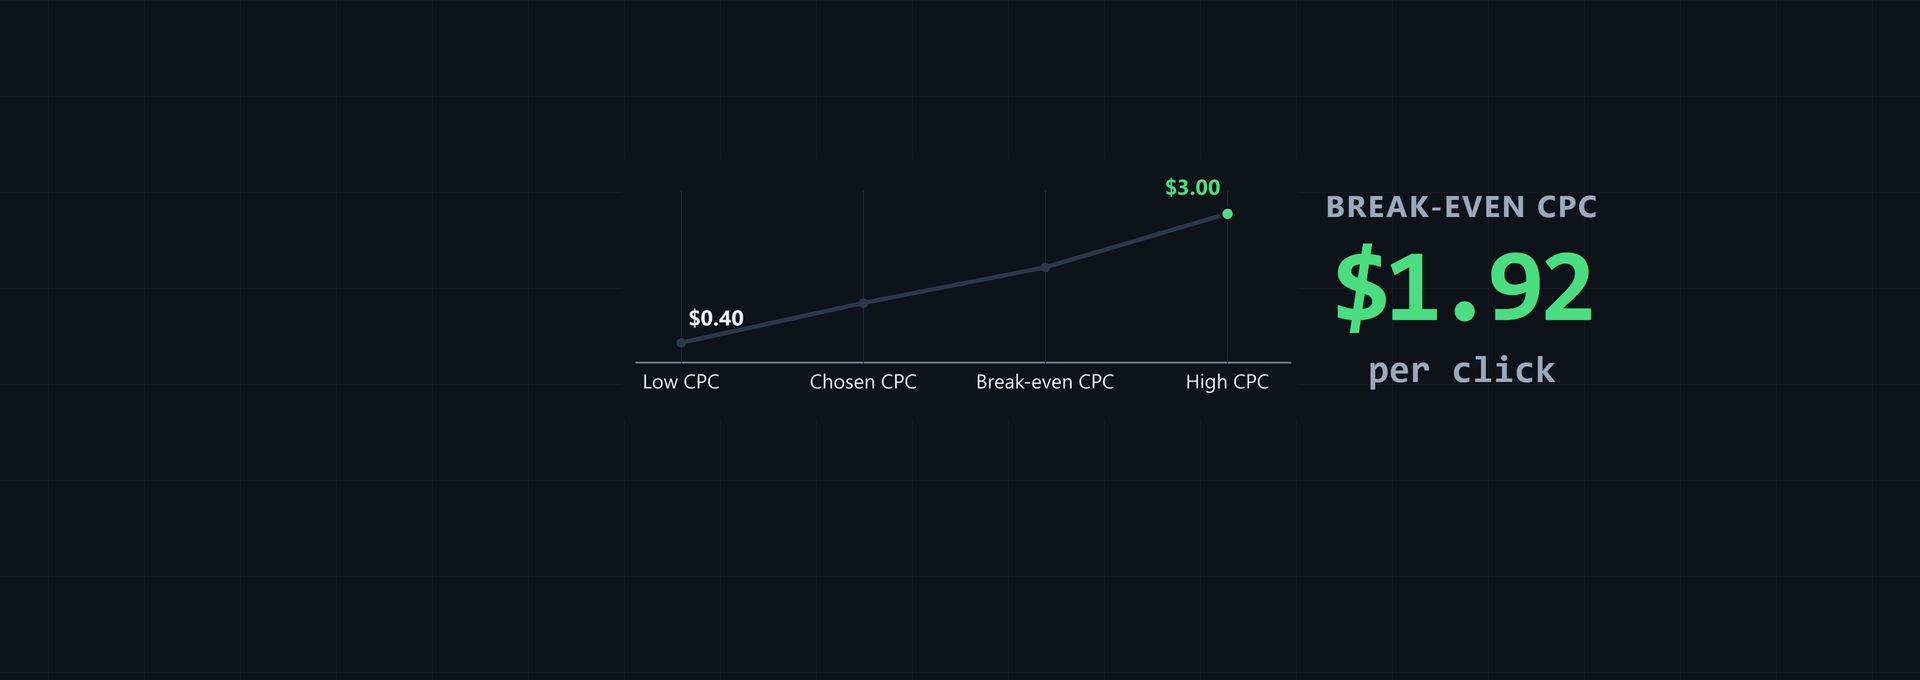
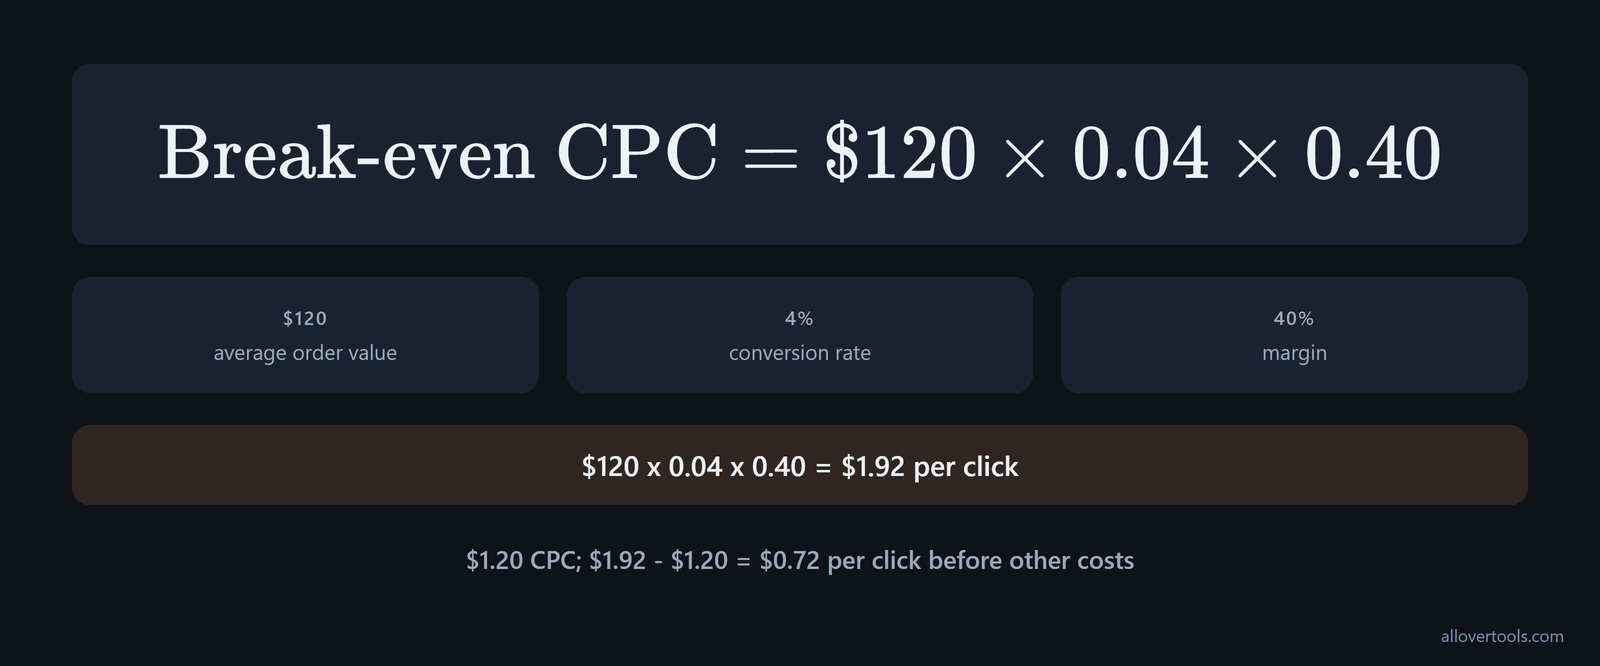
Chosen values: $120 average order value, 4% conversion rate, 40% margin
Break-even CPC = $120 x 0.04 x 0.40
               = $1.92 per click

Chosen CPC = $1.20
$1.92 - $1.20 = $0.72 per click before other costs
At the chosen $1.20 CPC, the example leaves $0.72 per click in contribution before other costs. These are chosen values, not an industry benchmark. The Conversion Rate Calculator for matching conversions divides conversions by a selected denominator. The CPC Calculator for spend divided by clicks covers the cost side.
Calculate the CPC your unit economics can support
For the first example, $120 x 0.04 gives $4.80 of revenue per click. Multiplying that by the 40% contribution margin gives $1.92 of contribution per click.
At $1.20 CPC, the result is $0.72 below that amount. Treat it as a ceiling, not a bid recommendation. You can use this method to evaluate cpc performance without a generic number.
Set a CPC ceiling from target CPA
If a campaign has a target CPA, calculate the CPC limit from its conversion rate instead of borrowing a benchmark. Maximum CPC equals target CPA multiplied by conversion rate. If target CPA is $50 and conversion rate is 5%, the maximum CPC is $2.50, based on the CPA method.
At that conversion rate, actual CPC above $2.50 can't meet the CPA target. A CPC that looks good beside another account doesn't change the limit.
Lead-generation campaigns use the same calculation because the immediate outcome is a qualified lead rather than a sale. With a $60 target cost per lead and a 2% historical conversion rate, good CPC is $1.20. Match the conversion rate to the lead definition, then review the resulting CPA against lead quality. Don't treat $1.20 as a general benchmark; the lead-generation example shows why.
Spot the low-CPC trap
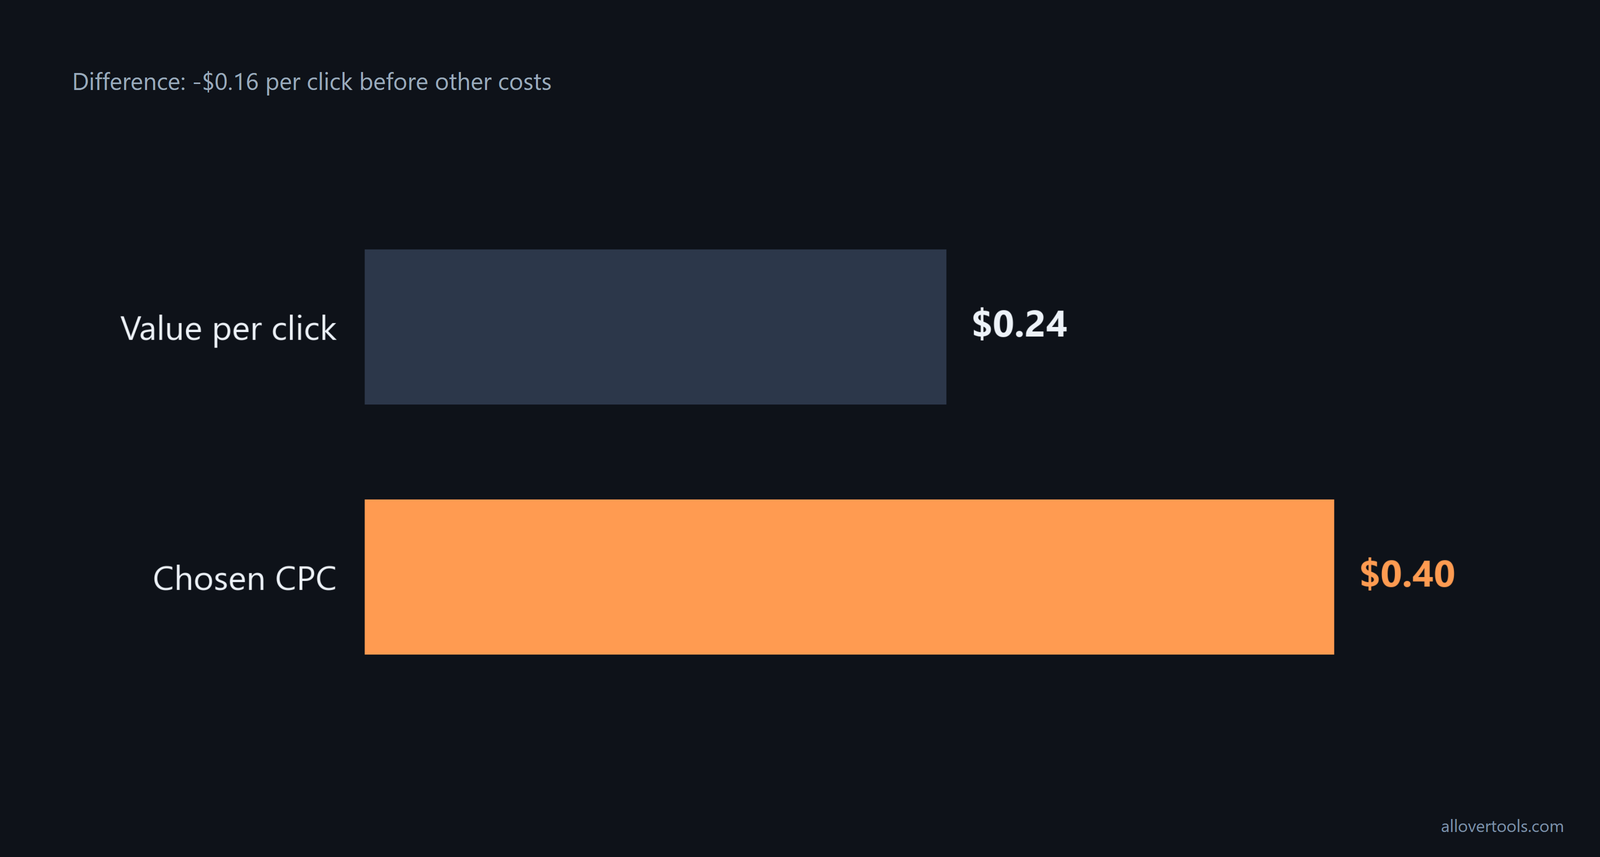
A low CPC can still lose money when traffic converts poorly or produces low-value orders. Could a cheaper click still lose? Yes. Use an $80 average order value; set conversion rate to 0.5% and contribution margin to 60%.
Value per click = $80 x 0.005 x 0.60
                = $0.24

Chosen CPC = $0.40
$0.24 - $0.40 = -$0.16 per click before other costs
At $0.40 CPC, the price is lower than $1.20, but traffic produces only $0.24 per click. The difference is -$0.16 before other costs. Cheap traffic is a bad trade when it doesn't convert well enough, and your sheet won't fix it.
Use ROAS to interpret a high CPC
ROAS adds attributed revenue to the CPC decision. It's a revenue-to-ad-spend ratio, not a full profit measure, so check the margin behind the revenue before deciding if a higher CPC works.
The ROAS Calculator has Currency and Period, plus Total advertising spend and Attributed revenue; Target ROAS - optional is available too. Its outputs include ROAS (Return on Ad Spend), and it also gives Revenue minus spend and Implied ROI. Marketing Metrics Calculator puts CPC beside ROAS, with Conv. rate in the same row for multiple campaign rows.
For sales-focused campaigns, set the CPC ceiling from the return you need. Good CPC = (average sale value x conversion rate) / (1 + target ROI). With a $25 average sale value, 3% conversion rate, and 400% target ROI, the result is $0.15. The calculation ties CPC to the return you chose, using the sales ROI formula rather than a generic average.
One quick ROAS check says advertisers usually want to make at least $0.20 back on every dollar spent. A "really good" CPC rate is described as earning $2 for each $1 spent. Treat this ROAS rule as a starting point, then set the actual threshold from margin and CLV; the same ratio can support different decisions.
A high CPC can still return more value
These chosen values show why a high CPC needs campaign context. A price alone can't tell you enough.
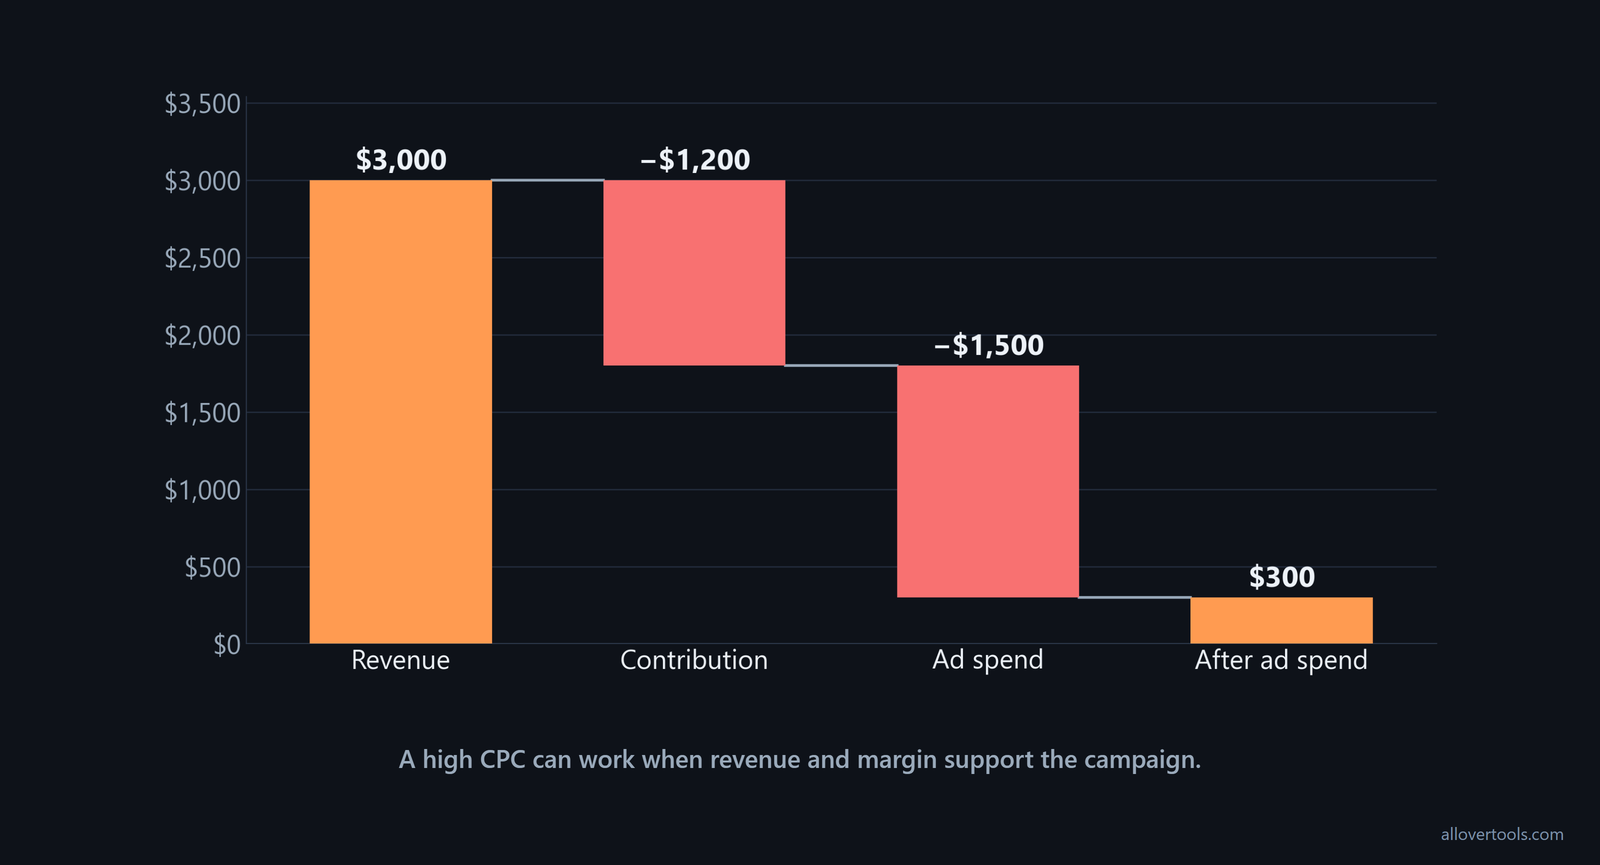
Total advertising spend = $1,500
Clicks = 500
CPC = $1,500 / 500 = $3.00

Conversions = 30
Conversion rate = 30 / 500 = 6%

Average order value = $100
Attributed revenue = 30 x $100 = $3,000
ROAS = $3,000 / $1,500 = 2.00:1

Contribution at 60% margin = $3,000 x 0.60 = $1,800
Contribution after ad spend = $1,800 - $1,500 = $300
This campaign pays $3.00 per click and leaves $300 once ad spend is removed, at 60% contribution margin and before other costs. Whether that trade works depends on your goal.
Why ROAS is not profit
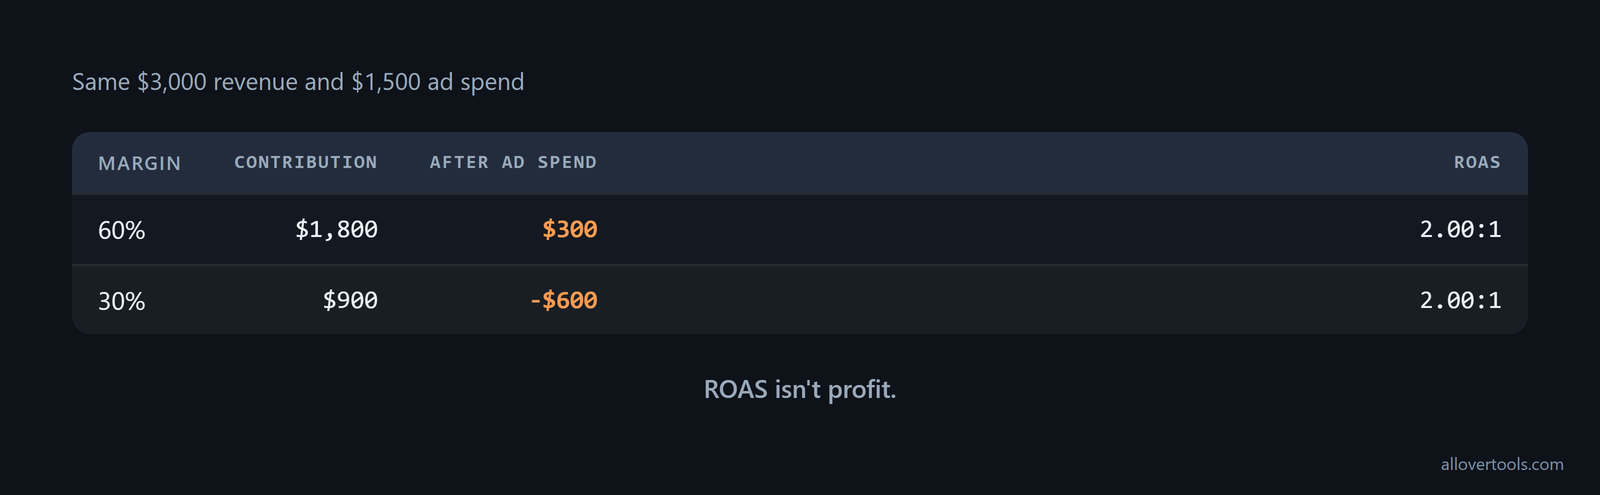
ROAS uses attributed revenue and ad spend, so product and operating costs sit outside the ratio; the same ROAS can support different decisions at different margins.
At a 60% margin, $3,000 x 0.60 gives $1,800 of contribution. Subtracting the $1,500 ad spend leaves $300. At a 30% margin, the same revenue gives $900 of contribution; $900 - $1,500 equals -$600.
Both cases have a 2.00:1 ROAS. Goods and refunds remain outside this calculation. Discounts and fees do too, as does overhead, so ROAS isn't profit.
Judge CPC trends, not one number
Compare CPC across matching periods or campaign totals, then put downstream value beside it. One CPC figure can't show whether the traffic became more useful. Your review needs definitions.
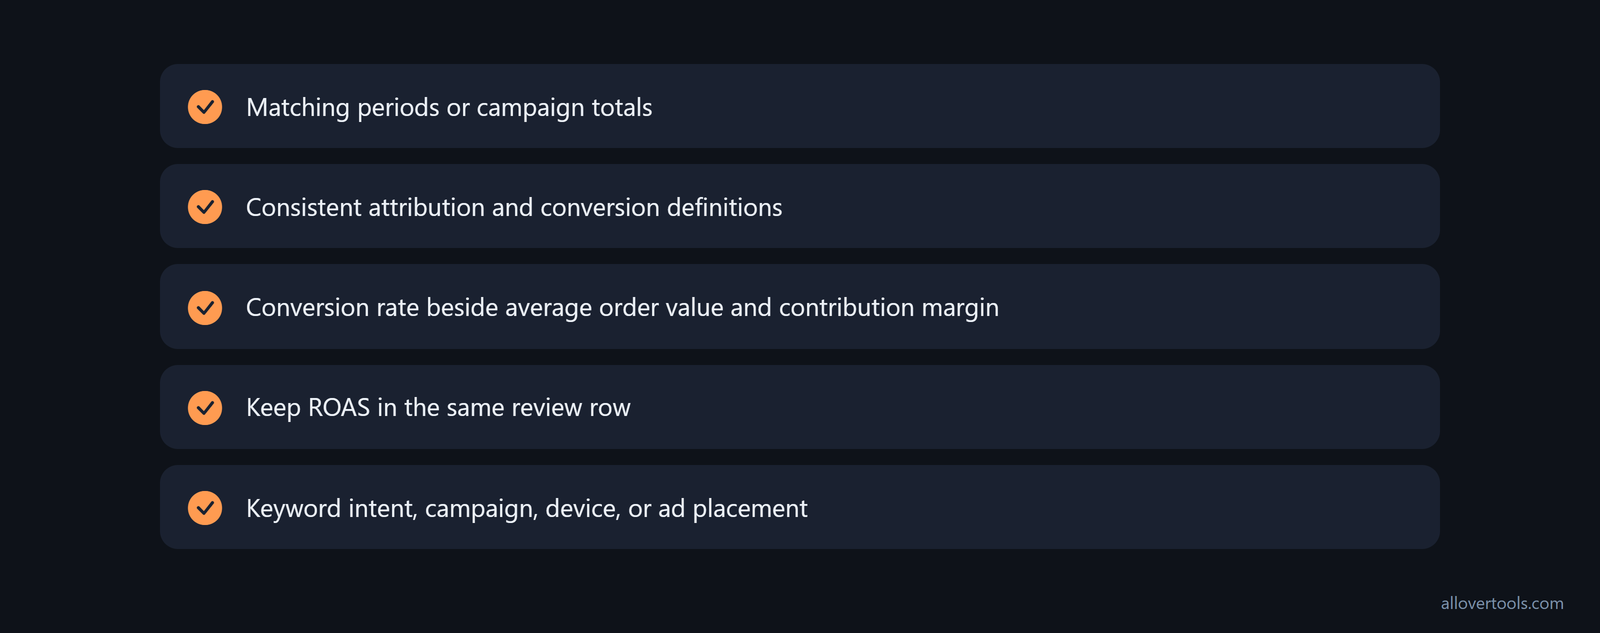
- Calculate CPC for comparable periods or full campaign totals. Keep currency, spend, clicks, and campaign scope aligned.
- Use consistent attribution and conversion definitions in each review row.
- Record conversion rate beside average order value and contribution margin. Keep ROAS in the same review row.
- Split a change by keyword intent, campaign, device, or ad placement when those dimensions are available.
A rising CPC can be acceptable if conversion value or ROAS rises with it. A falling CPC can hide weaker traffic or lower-value orders. Investigate the change before changing a bid, then check what your customers actually do after the click.
Check competition and placement mix. Then check query mix and landing-page performance. These can move CPC and downstream value in different directions, even within your account.
Use your own history as the primary benchmark. Monitor CPC over time and compare it with historical data to spot inefficiencies and opportunities. Plot CPC beside conversion rate, ROAS, and LTV. If targeting, query mix, or placement changes, investigate any deviation.
Higher CPC around peak demand is acceptable if ROAS rises. What matters is what CPC delivers relative to LTV and ROAS. That is the comparison described in this historical method.
For a matching period calculation, enter aligned figures in the CPC Calculator. Check the denominator in Conversion Rate Calculator. Marketing Metrics Calculator can place several campaign rows beside one another.
Make each period comparable
Use the same time or campaign scope. Don't mix clicks from one interval with spend from another.
Log CPC with rate and order value. Keep margin and ROAS beside them. Period labels don't repair mismatched figures, so keep definitions beside values when you explain a change.
Read placement and quality signals together
Competition can move CPC while query intent and landing-page fit move the value of the traffic. When the price changes, inspect the traffic slice that changed. You may find the cause in the mix.
The low-CPC example produced $0.24 of value per click against a chosen $0.40 CPC. The high-CPC example had a chosen $3.00 CPC and ROAS of 2.00:1, leaving $300 after ad spend with 60% margin before other operating costs. One snapshot doesn't explain both outcomes.
Improve value without lowering CPC
A campaign can improve while CPC stays fixed. Conversion rate and average order value can change the result. So can margin.
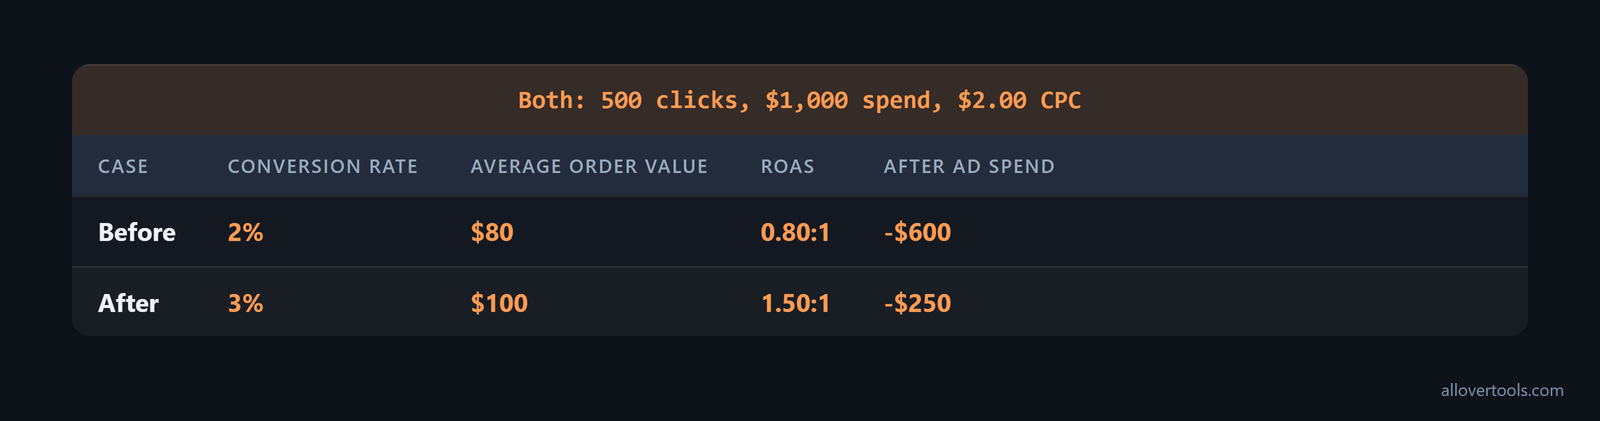
With 500 clicks at $2.00 CPC, spend remains $1,000; compare the chosen values. These figures show the arithmetic, not a promised outcome.
Raise conversion value at the same CPC
Both rows use 500 clicks and $1,000 in spend at the same $2.00 CPC. The difference comes from conversion rate and order value.
Before:
500 clicks x $2.00 CPC = $1,000 spend
10 / 500 = 2% conversion rate
10 x $80 = $800 revenue
$800 / $1,000 = 0.80:1 ROAS
$800 x 0.50 = $400 contribution
$400 - $1,000 = -$600 after ad spend

After:
500 clicks x $2.00 CPC = $1,000 spend
15 / 500 = 3% conversion rate
15 x $100 = $1,500 revenue
$1,500 / $1,000 = 1.50:1 ROAS
$1,500 x 0.50 = $750 contribution
$750 - $1,000 = -$250 after ad spend
That change raises conversion rate from 2% to 3% and order value from $80 to $100 while CPC stays at $2.00. Compare rows in Marketing Metrics Calculator, then verify conversions divided by clicks with Conversion Rate Calculator.
Know when improvement is still not enough
The after row reaches $750 of contribution but still ends at -$250 after ad spend. Better performance isn't enough when contribution remains below the advertising cost, so you need wider unit economics.
Check the ad and landing page against the query. Remove clicks that can't become customers. Improve the offer or checkout path. Use bundles or upsells when appropriate.
This example still misses a positive contribution-after-ad-spend result. Your next decision can involve conversion quality and order value. Margin is another concern. Traffic allocation is another option instead of CPC alone.
Frequently asked questions
What CPC fits my industry?
There's no useful universal number. Compare CPC with average order value and conversion rate; add contribution margin. Check its ROAS and trend with matching definitions and periods. The affordable CPC formula multiplies average order value by conversion rate and contribution margin percentage.
Is a high CPC always bad?
No. A higher CPC can fit your goal when the clicks produce enough margin and revenue. Judge it with unit economics and ROAS instead of CPC alone.
Can a low CPC still lose money?
Yes. Low-cost clicks can produce too few conversions or low-value orders, leaving contribution per click below CPC. Check conversion rate and order value. Then check margin and revenue after ad spend.
Should I compare CPC across different campaigns?
Only after matching or separating period and campaign scope. Also match keyword intent and placement. Check currency and conversion definitions. Use Marketing Metrics Calculator for side-by-side rows, then judge each CPC against its own downstream value.