An agency billing rate strategy turns role rates into a firm-wide revenue plan. It starts with each role's client rate and realistic billable capacity, then rolls those figures into a weighted firm rate, a profit target, and a review process for realized rates and write-offs. The point is to see how one pricing change affects the whole agency before it reaches a quote.
Build a role-based agency rate card
A role-based rate card gives each delivery role its own client billing rate. It is not a salary list. Each line needs the role, a planned utilization assumption, and a reason to revisit it, such as a changed staffing mix or a revised revenue target.
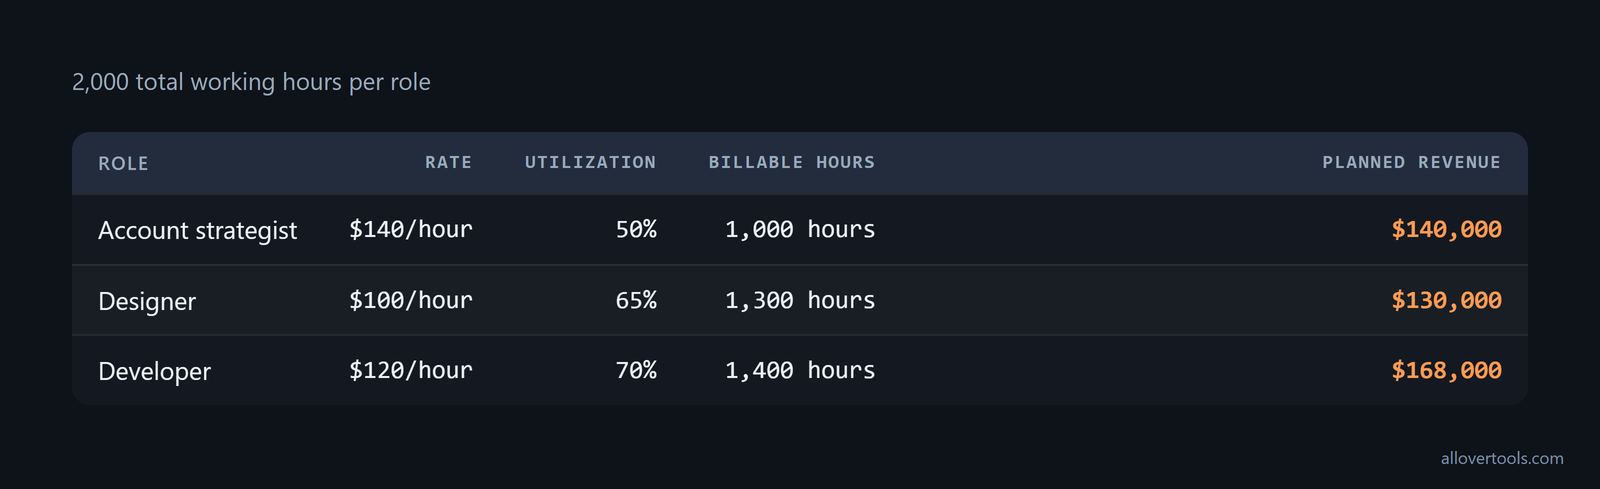
Use these chosen planning values for a small agency. All three roles have 2,000 total working hours per year, but utilization determines how many of those hours are billable:
Choose rates by role and capacity
| Role | FTE | Rate charged | Utilization | Billable hours | Planned revenue |
|---|---|---|---|---|---|
| Account strategist | 1 | $140/hour | 50% | 1,000 | $140,000 |
| Designer | 1 | $100/hour | 65% | 1,300 | $130,000 |
| Developer | 1 | $120/hour | 70% | 1,400 | $168,000 |
For each row:
Billable hours = working hours × utilization
Role revenue = billable hours × role rate
Those same fields work in a rate card for creative agencies: role, client rate, capacity assumption, billable hours, and planned revenue.
Each role needs its own minimum viable rate. A firm-wide average can hide a role that loses money. Use Minimum viable rate = (salary + benefits + overhead) / annual billable hours / (1 - target profit margin), with the same role-level billable-hours assumption as the plan; the per-role formula makes the floor clear. Check that floor against the proposed client rate before publishing the card. If the role rate falls below it, change the staffing mix or the target deliberately. Otherwise, the other roles quietly absorb the loss.
Use 2.5-3x fully loaded hourly labor cost as a quick check. The floor is 2.5x; at 3x, the rate commonly splits into roughly one third delivery labor, one third overhead, and one third profit, as the 2.5-3x guidance describes. A related heuristic says revenue-generating employees should bring in 2-3 times their salary cost. Use both checks against the role calculation, but let the agency's actual expenses and utilization decide the rate.
The multiplier should fit the agency's cost structure and positioning. These bands, based on Swydo's multiplier bands, help test an assumption copied from a different type of firm:
| Agency type or positioning | Cost-to-rate multiplier |
|---|---|
| Low-cost or offshore agency | 2-2.5x |
| Mid-market agency | 3x |
| Large agency with significant overhead and premium positioning | 4-5x |
Keep the cost-covering floor separate from the target rate when negotiating. The floor is Annual costs / billable hours; with a 35% margin target, the target rate is Minimum rate x 1.35. The gap between the minimum viable rate and what the market will bear is the strategic pricing range described in the floor-to-target method. Test a discount against that range so a concession does not slip below the rate that covers the chosen cost base.
Use the client-facing card as an operating document, not just a list of three hourly numbers. It should include:
- the services provided and a short description of each;
- hourly rates, fixed-price ranges or discounts, billing terms, and extra costs such as markups or rush fees;
- rate categories such as standard rates, discount rates for non-profits, and last-minute job rates; and
- whether the quote uses staff rates or a blended rate.
Calculate total cost and overhead per FTE before marking up by roughly 20%. Update the card annually as an industry best practice; these fields come from Productive's rate-card checklist. Keep the role table as the control total, even when the client sees a shorter version.
Planning for 100% utilization leaves no room for sales, administration, leave, leadership, or delivery overhead. Keep an internal cost rate separate from the client rate. When a role rate changes, check the effect on the total revenue target instead of editing one number in isolation.
The Billable Hourly Rate Calculator turns an income target, expenses, working hours, and utilization into a required rate. Its code uses the entered values only and has no fetch, XMLHttpRequest, sendBeacon, or form-post path, so those inputs stay in the browser.
Use a blended rate strategically
A blended rate is total planned billable revenue divided by total planned billable hours. It gives the client one hourly number for a mixed team, but it does not replace the internal role card. The delivery plan still needs role-level hours and revenue.
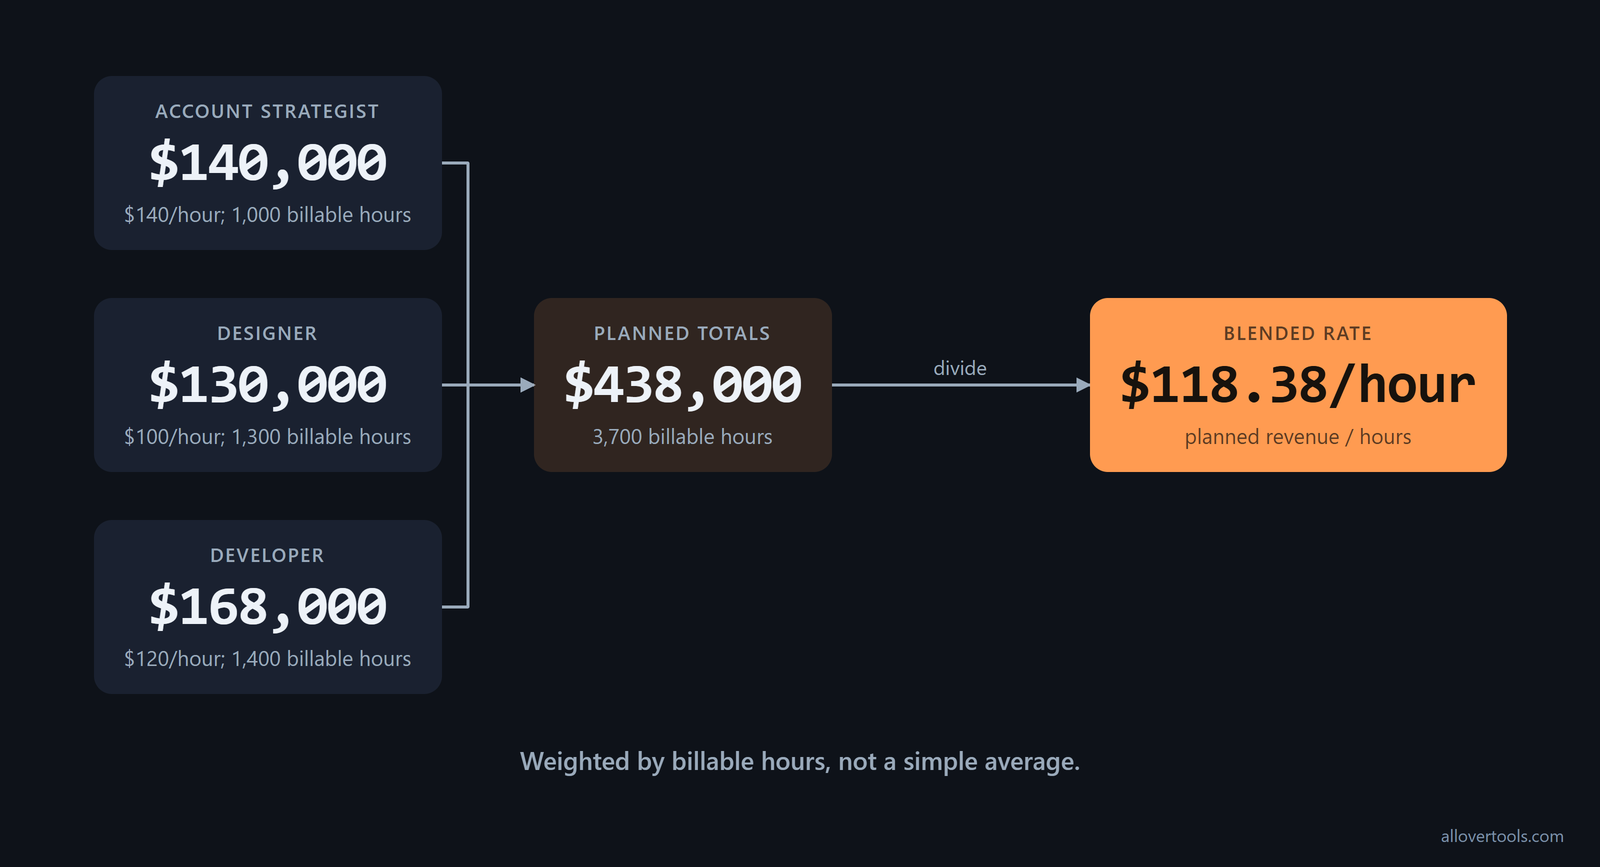
A blended rate fits a scope that uses several roles or a client who wants one hourly figure. It can also suit an agency selling a team outcome. The risk appears when the work mix is mostly junior or senior hours, one role is repeatedly overused, or the quoted blend falls below the rate required by the actual staffing mix. These are chosen values, not a market comparison.
Blended vs role based billing is a quoting choice, not a reason to discard role-level planning. Keep the staffing mix visible internally.
Hourly billing is only one part of the pricing mix. One survey puts project-based models at roughly 50% of agency revenue, retainers at 44%, hourly rates at 30%, value-based models at 10%, and commission-based models at 1%. Use the survey mix to see whether the rate plan matches the agency's actual revenue mix. Role rates still matter when the client gets a fixed fee, retainer, value-based price, or commission structure.
Non-hourly prices still need an hourly check underneath. According to the pricing-model analysis, most agencies run two or three pricing models at once and base all of them on an hourly rate; that is where the margin gets set. Keep the role-level cost and margin calculation even when the proposal sells an outcome, deliverable, or recurring fee instead of hours.
Another option is to keep the hourly figure as an internal cost check rather than the client-facing price; this is the internal-cost rule. Use it to scope the work and test margin with the calculator, then decide whether the client sees a fixed, retainer, value-based, or other price.
The pricing model sets the margin range the rate plan needs to support. The reported typical average gross margins are:
| Pricing model | Typical average gross margin |
|---|---|
| Hourly billing | 47-55% |
| Fixed-price projects | 38-58% |
| Monthly retainers | 55-68% |
Compare the agency's realized project or retainer margin with the relevant range. Do not apply the hourly range to every quote; the figures are reported in the margin comparison.
Calculate the weighted blended rate
Planned revenue = $140,000 + $130,000 + $168,000 = $438,000
Billable hours = 1,000 + 1,300 + 1,400 = 3,700
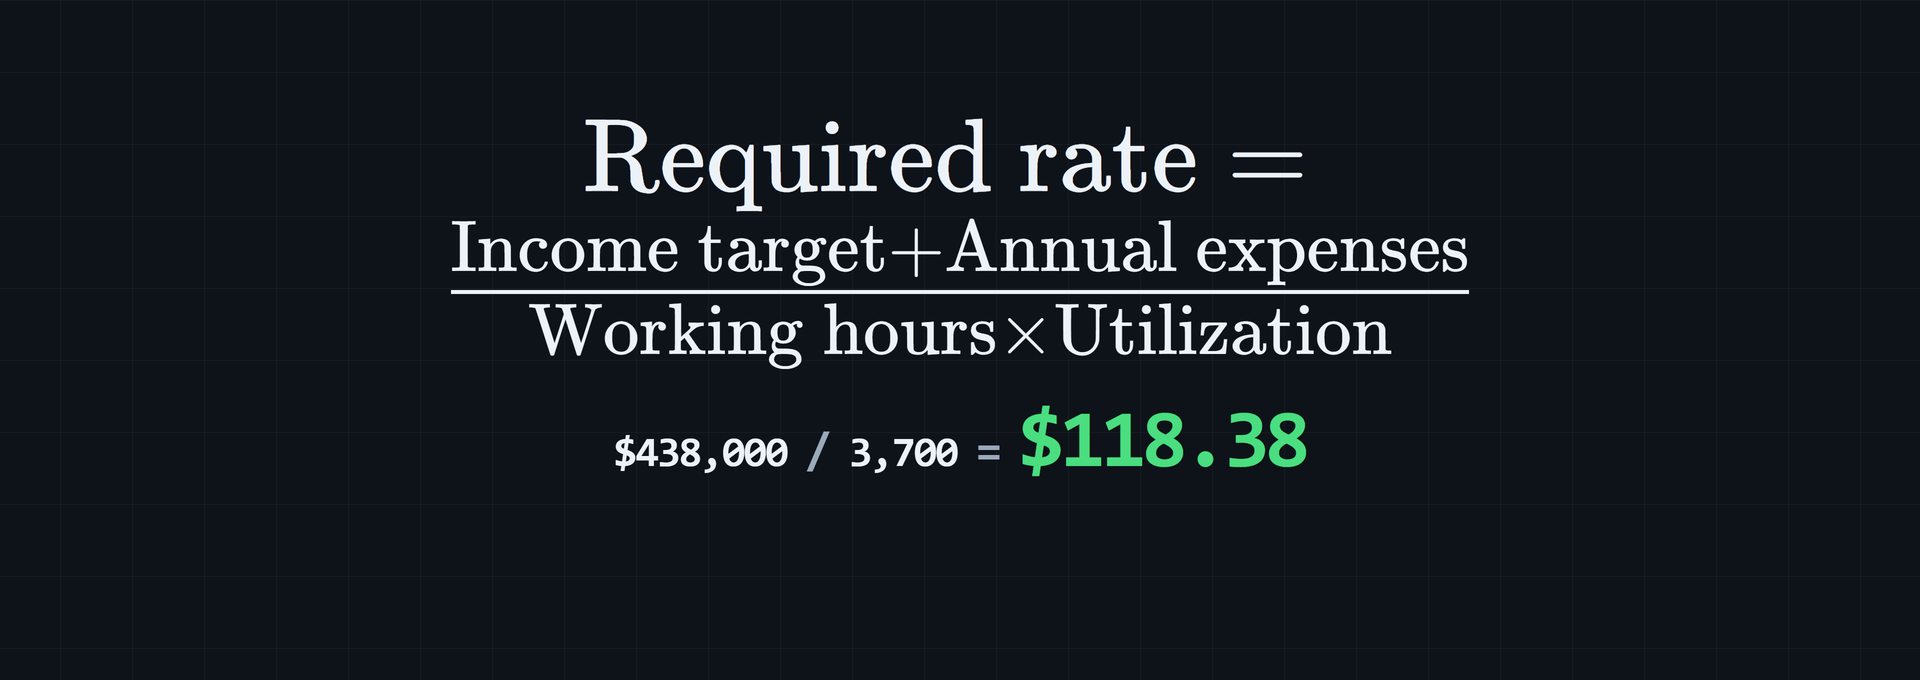
Blended rate = $438,000 ÷ 3,700 = $118.38/hour
Use the weighted result before quoting. Averaging the three displayed role rates would be wrong because the roles contribute different numbers of billable hours. Compare the proposed client blend with $118.38/hour while the delivery plan keeps the role-level hours and revenue visible.
Set utilization and revenue per FTE targets
Utilization is billable hours divided by total working hours. Revenue per FTE is planned revenue divided by the number of full-time-equivalent roles in the same period. Here, an agency utilization benchmark is an internal planning target based on capacity, leave, sales, administration, and delivery mix. It is not an external statistic.
With the case-study totals:
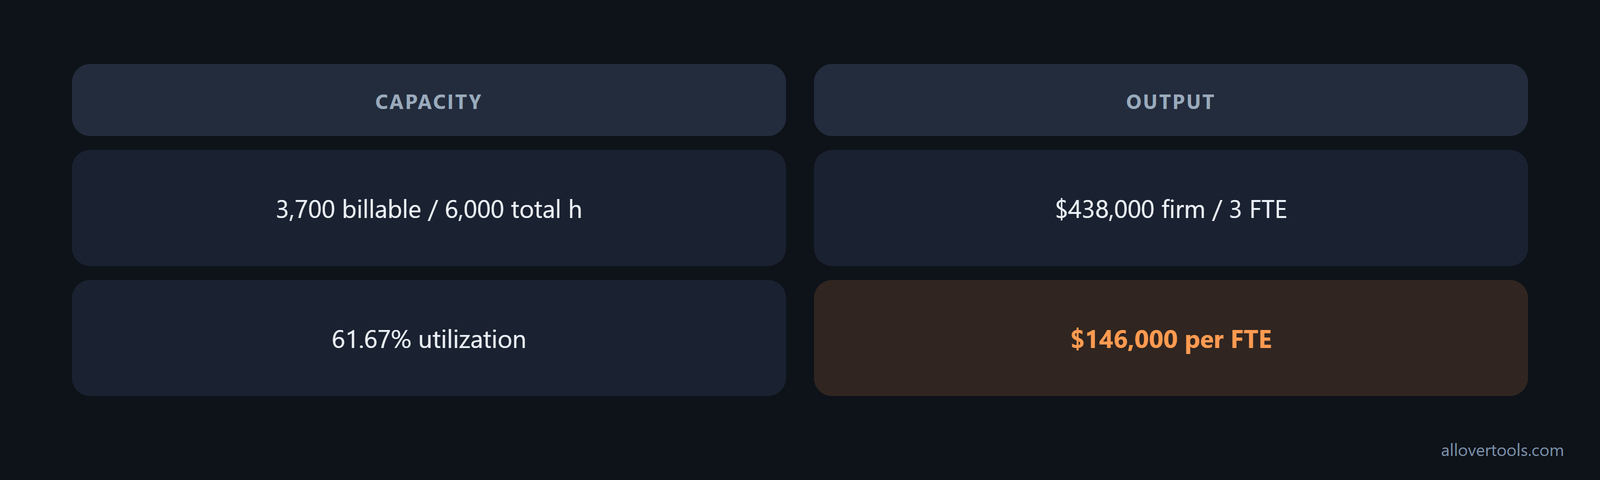
Firm utilization = 3,700 ÷ 6,000 × 100 = 61.67%
Revenue per FTE = $438,000 ÷ 3 = $146,000
The firm-wide result uses total hours, not the simple average of 50%, 65%, and 70%. Convert part-time staff to FTE consistently. Keep non-billable leadership time in the denominator. A utilization target without a revenue target can reward busy but underpriced work.
The case study's 61.67% can sit beside external benchmarks, but those benchmarks do not replace the agency's own capacity model. A 2025 professional-services benchmark covering just over 400 firms reports average billable utilization of 68.9%, the lowest figure in five years. Creative and marketing agencies often need 75-85% to stay healthy, as the benchmark report states. Put the agency's role mix and rate level next to that range before deciding whether the gap calls for higher rates, more billable work, or a different cost plan.
The mean is not enough on its own. Another benchmark reports 66.4% average billable utilization for 2025, based on 509 professional-services organizations with $63 billion in combined services revenue. It also reports 75.0% for high-performing organizations and 81.2% for top-maturity firms, with the figures set out in the 2026 benchmark. These bands let the agency label its target as an average, high-performing, or top-maturity comparison instead of calling any single percentage healthy by default.
Read utilization and revenue per FTE together
The 61.67% figure describes capacity converted to billable hours. The $146,000 figure describes the revenue produced by each FTE. A change in rates or utilization can move revenue per FTE, so review agency utilization and pricing alongside firm wide billable rate targets instead of treating either measure as a standalone score.
These comparisons only help if the input is measured consistently. Measure utilization weekly, for each person and project, and track it in real time. Tie every hour to a task and client, while protecting a deliberate non-billable budget, following the measurement guidance. Start the timer when work begins and categorize all time, including internal time, so the denominator is not rebuilt after delivery. Monthly reporting comes too late to change current work; the weekly record shows whether the agency needs to intervene in staffing, scope, or sales.
Small-agency case study: link rates to profit
Take the same three-person creative agency. The chosen annual values are $210,000 for direct delivery labor (COGS), $120,000 for operating expenses / overhead, and $108,000 for desired operating profit. The revenue requirement is:
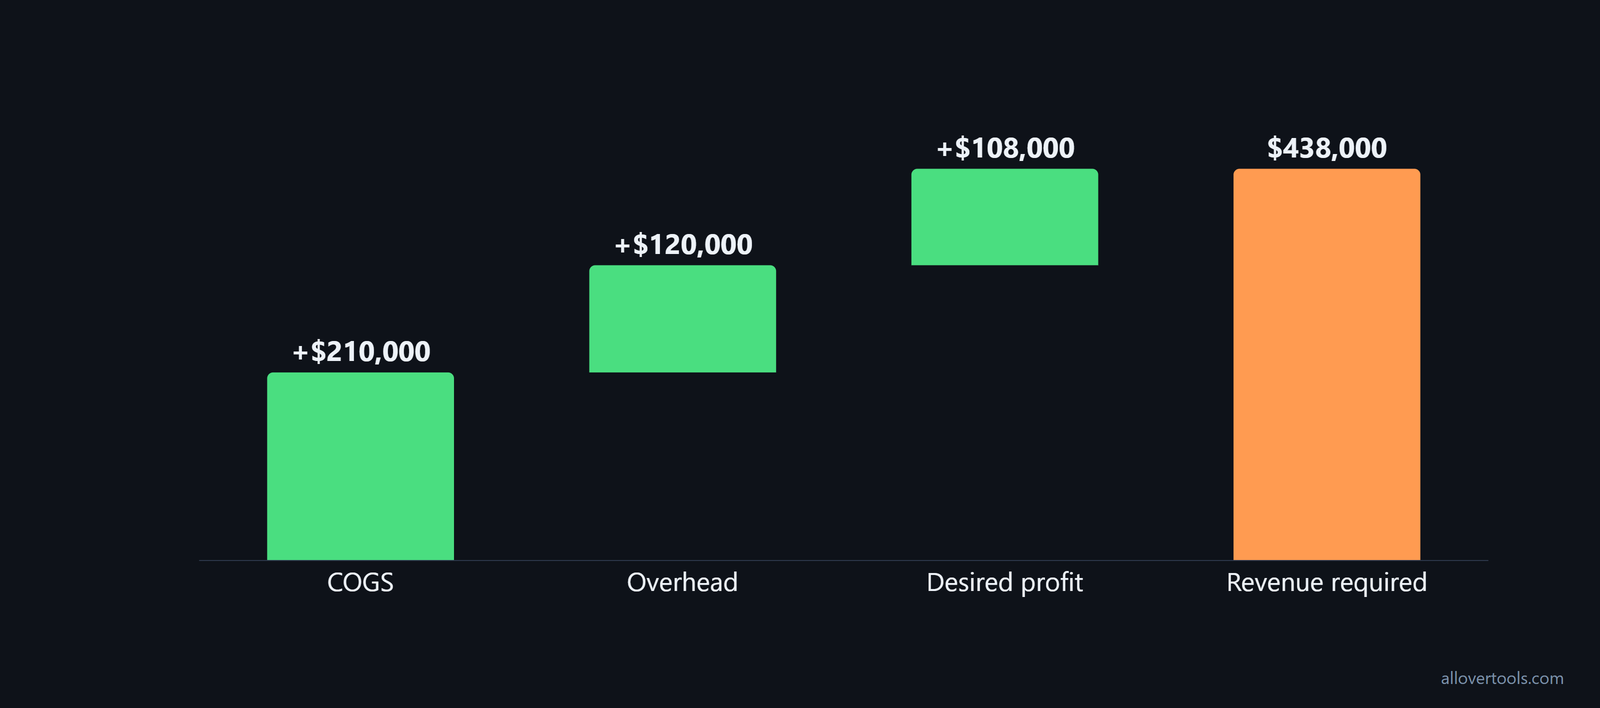
$210,000 COGS + $120,000 overhead + $108,000 desired profit
= $438,000 revenue required
That matches the role-rate plan. All three parts use the same $438,000 revenue figure.
Translate the target into a required firm rate
In the Billable Hourly Rate Calculator, enter Annual income target = $108,000, Annual business expenses = $330,000, Total working hours per year = 6,000, and Utilization rate (%) = 61.6667%. The $330,000 expense input combines COGS and overhead.
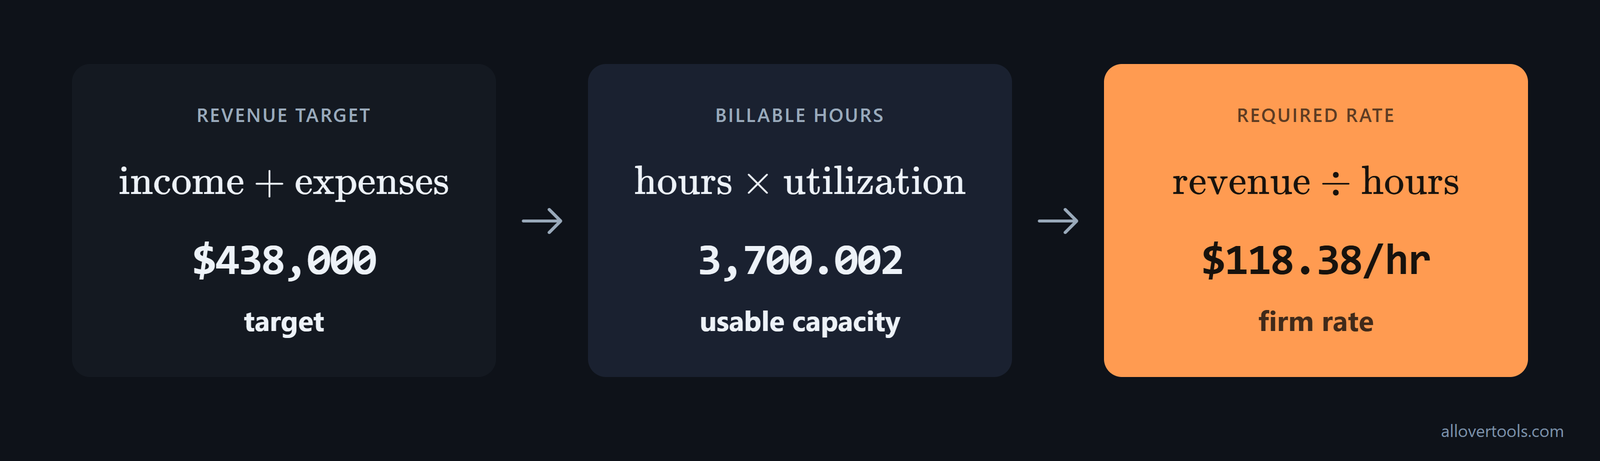
Billable hours = 6,000 × 61.6667% = 3,700.002, displayed as 3,700
Total revenue required = $108,000 + $330,000 = $438,000
Required rate = $438,000 ÷ 3,700.002 = $118.38/hour
If planned utilization falls, the same revenue target is spread across fewer billable hours, so the required firm rate rises.
Check the same target as profit and margin
In the Business Profit Calculator, select Calculation mode = Net profit margin. Enter Revenue = $438,000, Cost of goods sold (COGS) = $210,000, and Operating expenses / overhead = $120,000. Leave Estimated tax rate % (optional) blank, which uses 0%.
Gross profit = $438,000 − $210,000 = $228,000
Operating profit = $228,000 − $120,000 = $108,000
Net profit = $108,000 − $0 estimated tax = $108,000
Net margin = $108,000 ÷ $438,000 × 100 = 24.66%
Both tool scripts calculate from entered values and make no network request carrying those values. Treat this as a planning check, not accounting records. It excludes costs that were not entered, unpaid invoices, and actual tax liability.
Monitor realized rates, write-offs, and changes
A listed rate is the amount on the plan. A realized rate uses invoiced revenue divided by all actual hours logged against the work. Write-off hours are logged delivery hours that are not billed or recovered.
Non-billable meetings and context switching can cut revenue while the listed rate stays the same. A designer billing 30 hours per week at $150/hour might capture only 22 billable hours after those interruptions, a loss of $1,200 in revenue per week. this utilization example shows why billable time and effective hourly rate belong in the same review. Count that lost capacity alongside written-off delivery hours instead of assuming the rate card caused every shortfall.
Once the agency has enough comparable data, compare realized rates externally too. Average Billable Rate is total billable revenue divided by billable hours worked. AMI's 2024 benchmarking data reports these ranges:
| Agency group | Hourly effective rate range |
|---|---|
| Small agencies, 10-20 people | $95-$145/hour |
| Mid-size agencies, 20-50 people | $110-$165/hour |
| Specialist or niche agencies | $130-$200+/hour |
Use these ranges to check the agency's blended or realized rate, not to replace its cost floor; the definition and ranges are reported in the AMI ranges. A niche agency should not benchmark itself only against the small-agency band. A large rate also does not remove the need to check actual logged hours.
Promethean Research offers another check. Its service compares a standard or blended hourly-rate band with agencies of similar size and includes production utilization and hourly-rate ranges. Use the benchmark service when the firm needs a peer comparison for both rate and production utilization.
Find the cost of write-offs in the realized rate
Suppose 100 planned hours are billed at $120/hour:
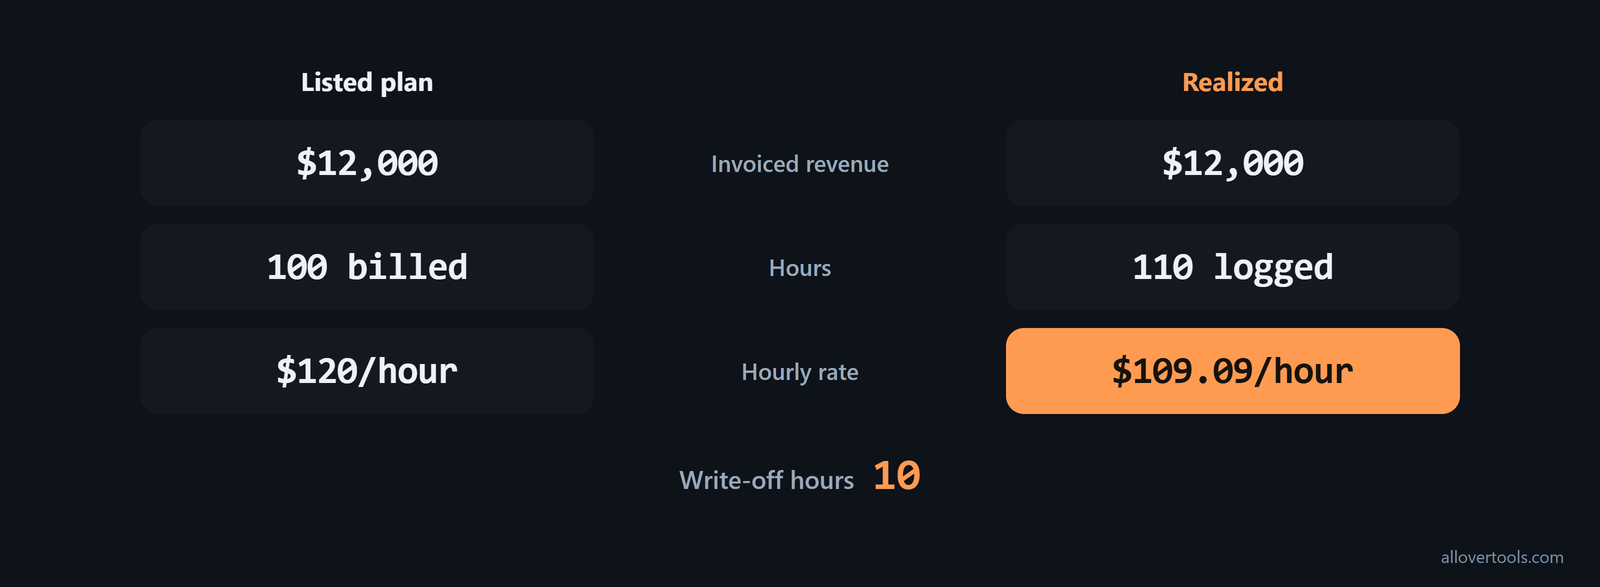
Invoiced revenue = 100 × $120 = $12,000
Actual hours logged = 110
Write-off hours = 110 − 100 = 10
Realized rate = $12,000 ÷ 110 = $109.09/hour
Break this result out by role, project type, scope change, and approval path. Looking only at the listed $120 rate hides the delivery effort that lowered the effective rate. The pattern can point to pricing, utilization, staffing, or scoping, so verify the time data before changing the rate card.
Recalculate when utilization or mix changes
If utilization falls from 61.67% to a chosen 55% across 6,000 working hours, the capacity and rate change:
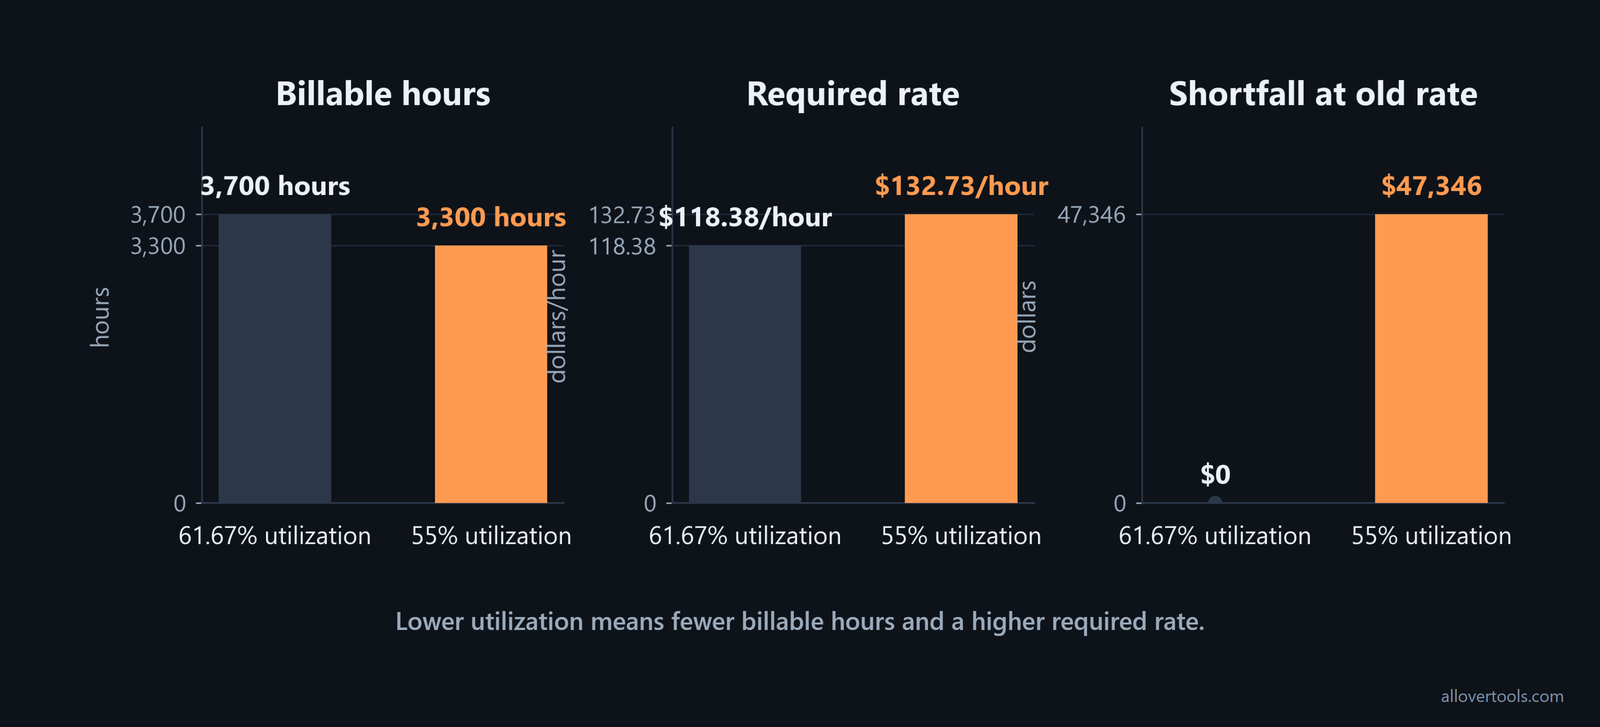
Billable hours = 6,000 × 55% = 3,300
Required rate = $438,000 ÷ 3,300 = $132.73/hour
Revenue at old $118.38 rate = 3,300 × $118.38 = $390,654.00
Shortfall = $438,000 − $390,654.00 = $47,346.00
The same idea can be checked at project level with the Project Profit Calculator, which uses the entered figures only. Enter Project revenue = $30,000, Materials / direct costs = $2,000, Labor hours = 180, Labor rate per hour = $55, and Allocated overhead = $3,000:
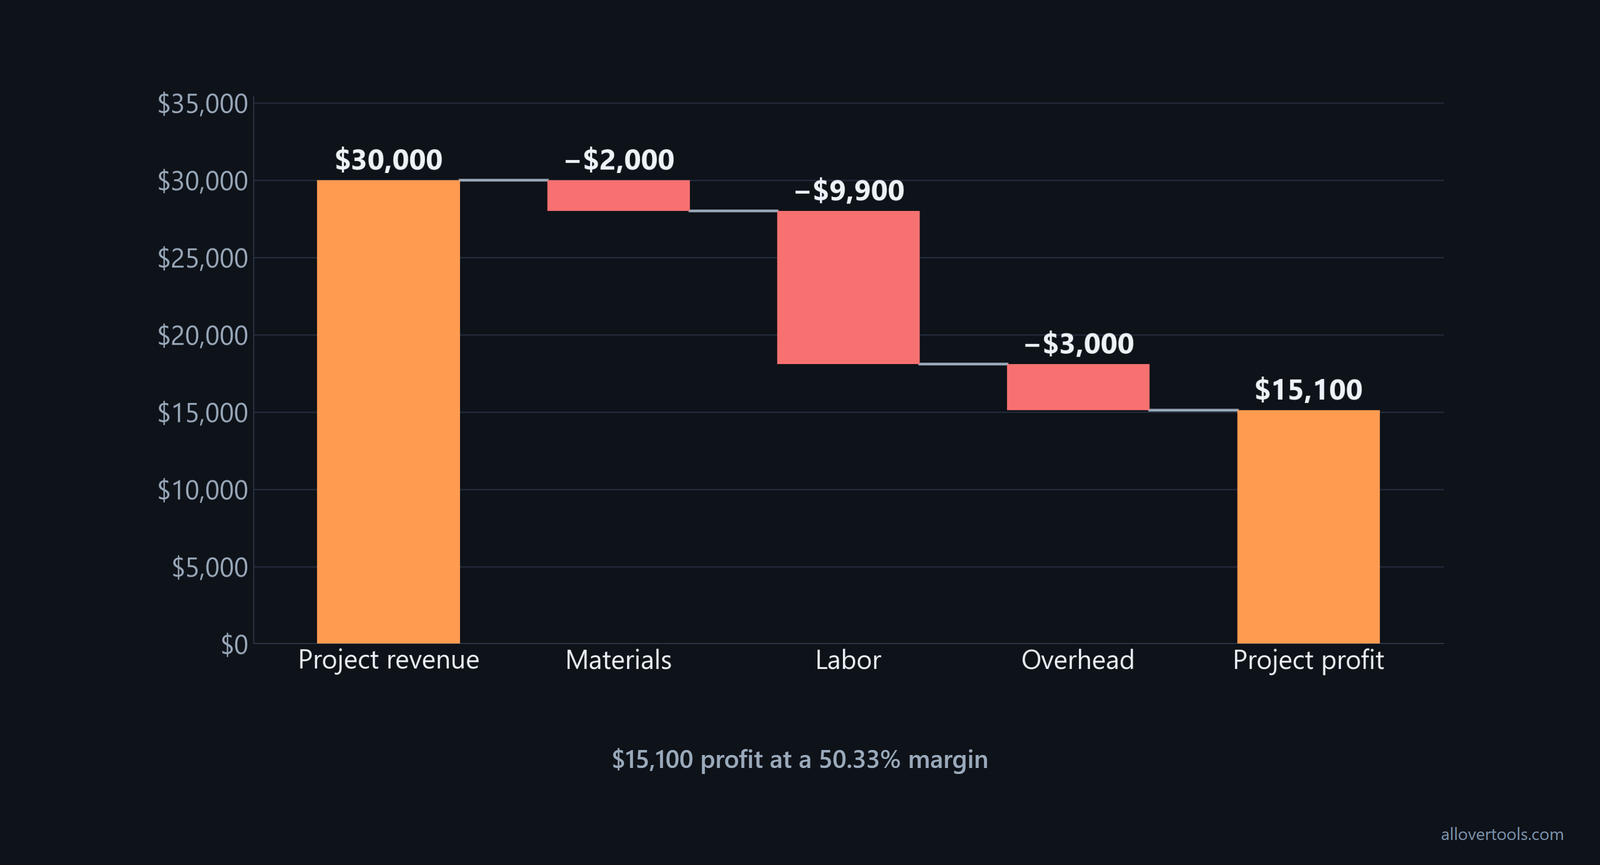
Labor cost = 180 × $55 = $9,900
Total project costs = $2,000 + $9,900 + $3,000 = $14,900
Project profit = $30,000 − $14,900 = $15,100
Project margin = $15,100 ÷ $30,000 × 100 = 50.33%
For a fixed project, turn the internal hourly estimate into a quote with a defined overrun buffer: Estimated hours x hourly rate x 1.3 buffer = project price. The 30% buffer in the 1.3 buffer rule covers scope creep, revisions, and uncertainties. Keep the unbuffered estimate visible so the team can separate role-rate economics from the amount added for delivery risk.
When the agency gets paid matters too. Charge clients upfront or use milestone-based billing at defined stages such as strategy approval, design delivery, or campaign launch. milestone billing guidance identifies these structures as a way to maintain positive cash flow and reduce the risk of unpaid work when scope and deliverables are clear. Match the billing schedule to the project or retainer structure instead of treating payment timing as separate from the rate strategy.
Keep a monthly dashboard beside the rate card. Track fully loaded cost per hour, minimum billable rate (2.5-3x cost per hour), utilization rate, monthly break-even, and recurring revenue ratio. the monthly metric set gives the five-number check. Recalculate the cost and minimum rate as the underlying figures change, then use realized rate and write-offs to explain why the plan is or is not holding.
Review the inputs in order: verify time data, recover or prevent write-offs, fix staffing or scope, then choose among role-rate changes, a revised blend, utilization changes, or a revised profit target.
Frequently asked questions
What is an agency billing rate strategy?
It connects role-based rates or a blended rate to billable capacity, revenue per FTE, operating costs, and a desired profit target. It also checks realized rates and write-offs after delivery.
How do you set agency billable rates?
Add annual expenses and desired profit, then divide by planned billable hours. Map the required firm rate back to role rates and the expected utilization mix before publishing a client-facing rate card.
What is the difference between blended and role-based billing?
Role-based billing assigns a separate rate to each role. Blended billing presents one weighted rate for a mix of roles. Keep the role-level plan internally even when the client sees only the blended figure.
How do you calculate an agency's realized billable rate?
Divide invoiced revenue by all actual hours logged against the work, including written-off hours. For example, $12,000 billed over 110 actual hours produces a realized rate of $109.09/hour.
When should an agency adjust its rate strategy?
Review it when utilization, staffing mix, scope, write-offs, realized rates, costs, or the desired profit target changes materially. Recalculate the required rate with the changed inputs instead of changing prices from one isolated project.