ARR multiple valuation compares enterprise value with annual recurring revenue, then checks that ratio against peer companies and cash-flow methods. The calculation is enterprise value divided by ARR, written as EV ÷ ARR. A 6x result means the enterprise value is six times the stated ARR. ARR is annualised recurring subscription revenue, so one-time fees, setup charges, and non-recurring discounts stay out of the denominator.
What is an ARR multiple in SaaS valuation?
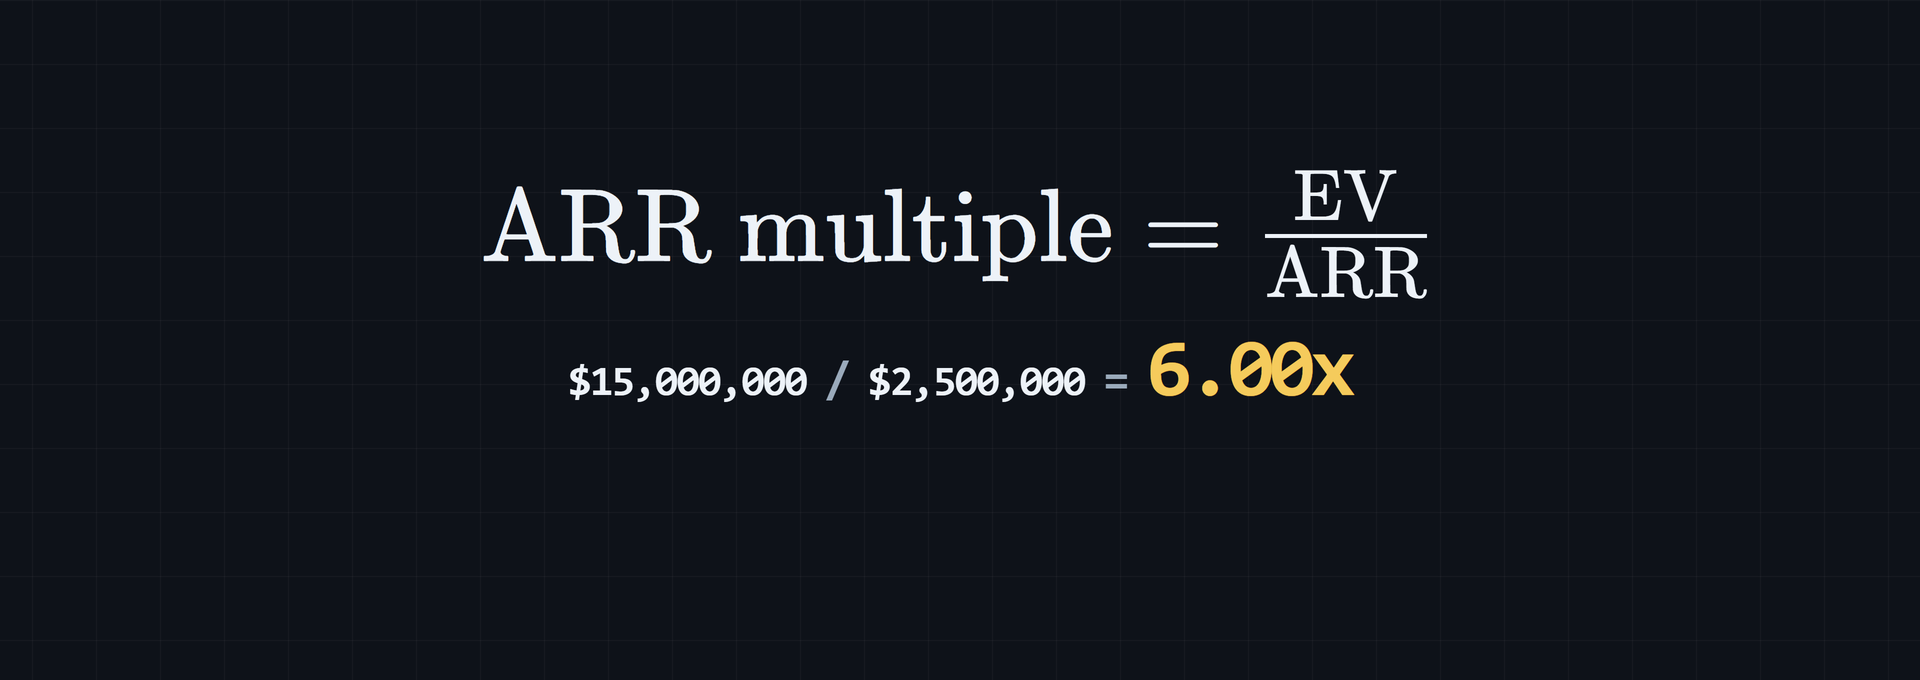
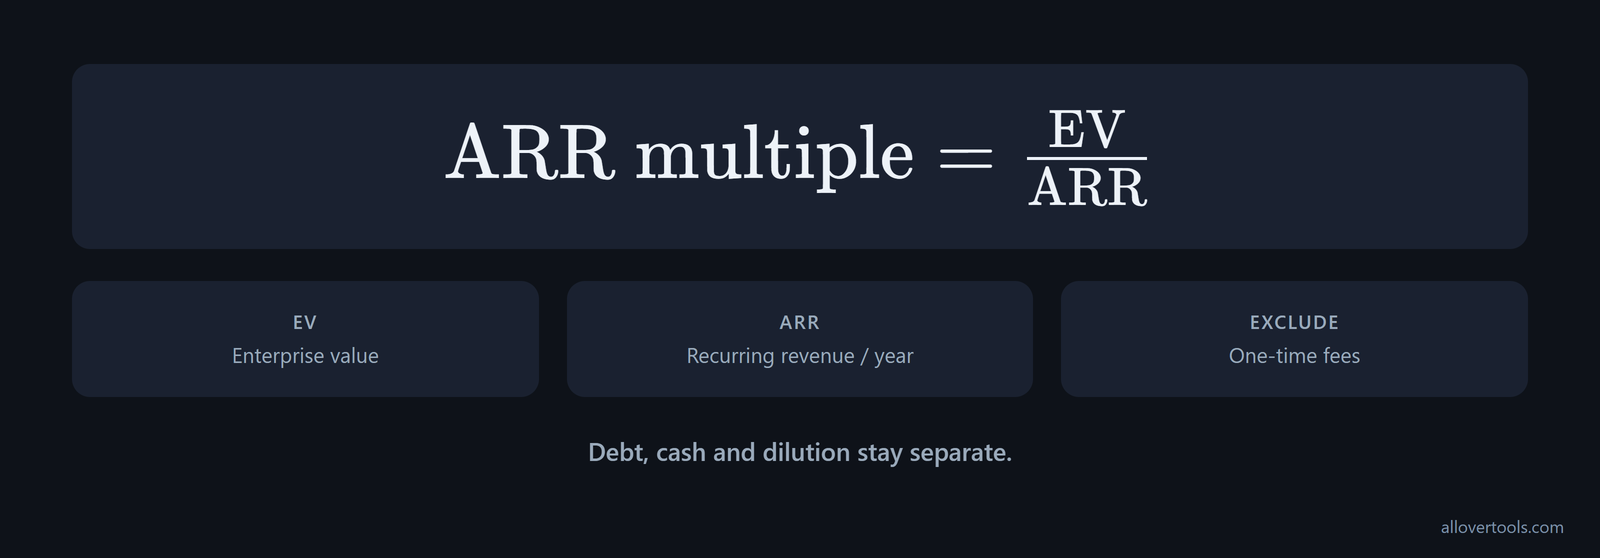
An ARR multiple is enterprise value divided by annual recurring revenue. It is written as EV ÷ ARR and reported with an x. A 6x multiple means the enterprise value is six times the stated ARR.
ARR means annualised recurring subscription revenue. Total revenue may also include services, implementation work, usage, or other amounts that will not recur. One-time fees, setup charges, and non-recurring discounts do not belong in ARR.
The numerator is enterprise value, not automatically the equity cheque or share price. Debt, cash, ownership terms, and dilution need their own treatment when the ratio is used in an equity discussion.
Enterprise value is the numerator adjusted for capital structure. It equals market capitalization plus total debt minus cash and cash equivalents. It represents what an acquirer would pay for the entire business, as the EV definition explains. Two companies with the same ARR and market capitalization can still have different EV ÷ ARR ratios if their debt or cash differs. Before dividing, check that the figure labelled EV includes this adjustment. A market-capitalization figure cannot substitute for enterprise value.
To estimate equity value from an ARR-derived enterprise value, keep the bridge separate from the ratio. ARR × multiple = enterprise value. Then enterprise value − interest-bearing debt + cash = equity value, as the debt-and-cash bridge sets out. Use this line in a cap-table or shareholder-value discussion. Keep debt and cash out of ARR, and do not treat the ARR multiple itself as the equity cheque.
How to calculate an ARR multiple from EV and ARR
The EV divided by ARR formula is simple:
ARR multiple = enterprise value ÷ ARR- Set the ARR period and the recurring-revenue items included.
- Calculate ARR from those items.
- Use the same currency and valuation point for enterprise value.
- Divide enterprise value by ARR.
- Add the
xlabel to the result.
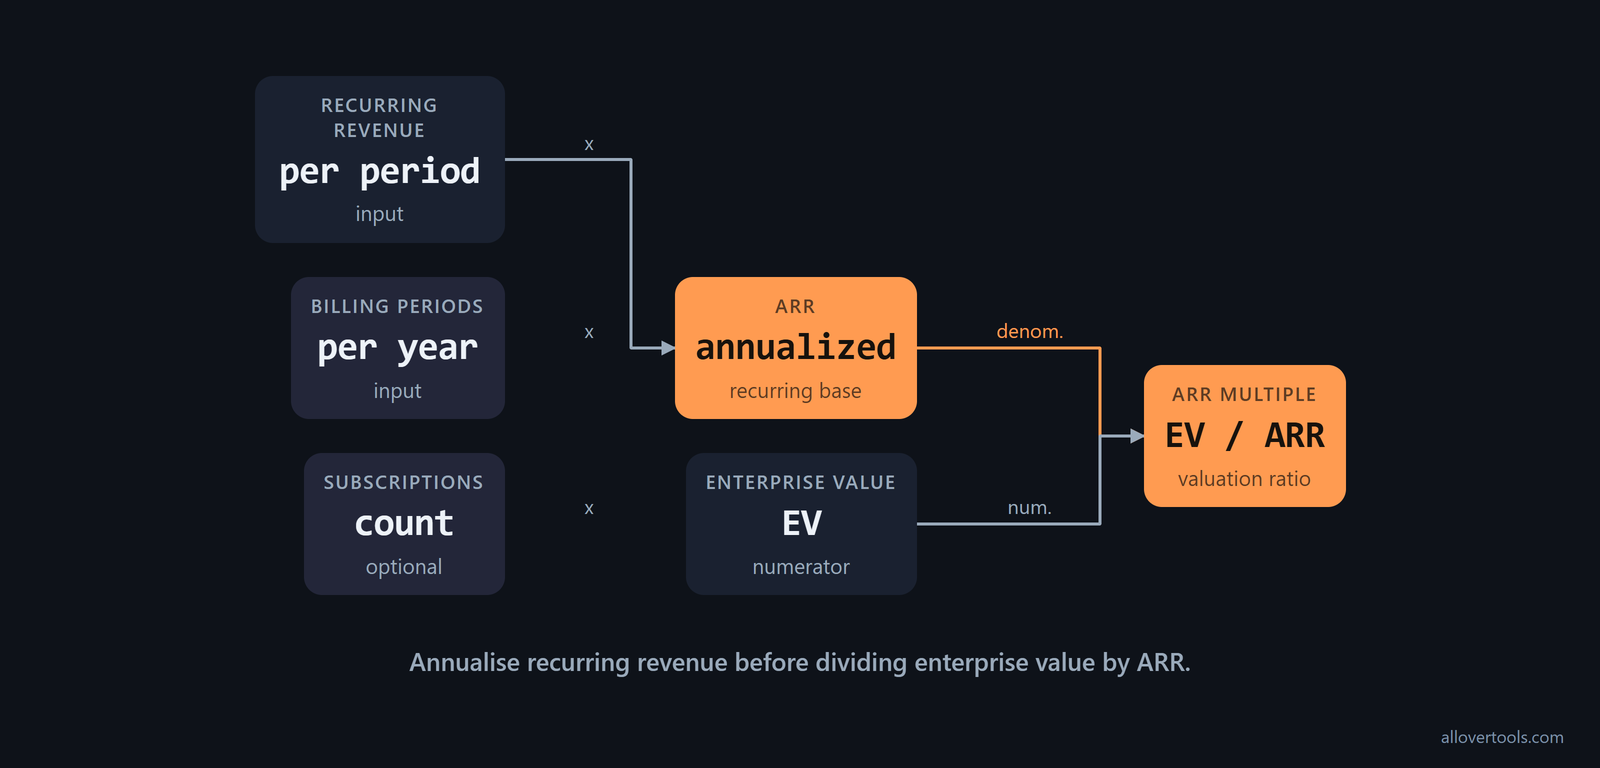
When a recurring amount needs annualising, the ARR Calculator uses three controls: Recurring revenue per billing period, Billing period, and Number of identical subscriptions (optional). Its formula is:
ARR = recurring revenue per period × billing periods per year × subscriptionsThe calculator excludes one-time fees, setup charges, and non-recurring discounts. Keep monthly MRR separate from annual ARR, do not substitute total revenue for EV, and use the same ARR definition for every company in a comparison.
The published regression baseline spells out its operating inputs: Valuation Multiple = -2.43 + (0.19 × SCI) + (6.21 × ARR Growth Rate) + (4.38 × NRR Rate). SCI is the SaaS Capital Index; the other inputs are the company’s ARR growth and net revenue retention rates, according to this valuation model. The model uses Company Valuation = ARR × Valuation Multiple, so treat it as a statistically backed baseline for a scenario. Then adjust for company-specific factors and market judgment. It helps show which growth, retention, and market-index inputs are driving the multiple; it is not a precise price to copy into a term sheet.
A worked 6.00x ARR multiple example
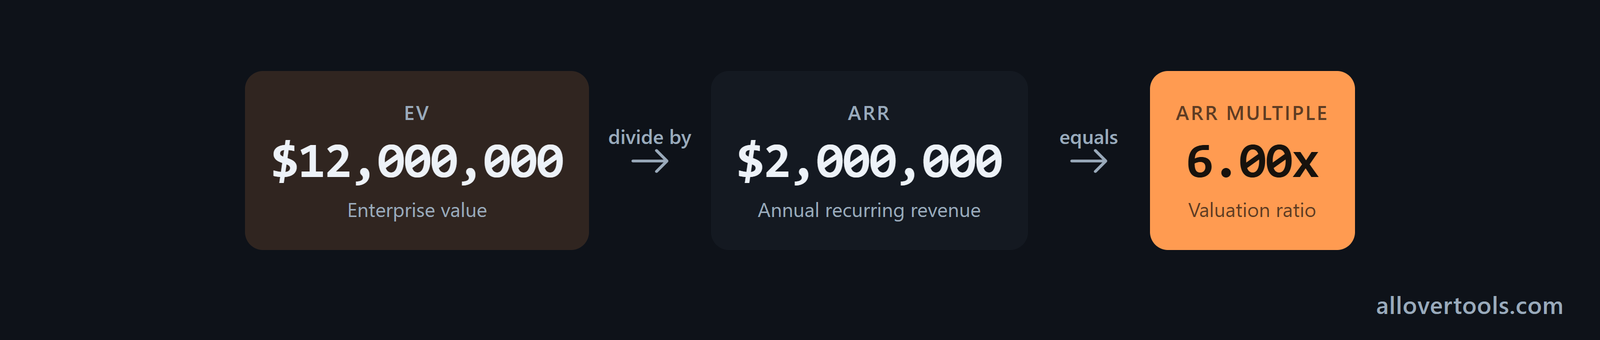
With one currency and one valuation point, the calculation is:
Enterprise value = $12,000,000
ARR = $2,000,000
ARR multiple = $12,000,000 ÷ $2,000,000 = 6.00x
The output is a valuation ratio. It is not a guaranteed return, a payback period, or an equity ownership percentage.
ARR multiple examples for SaaS peer benchmarking
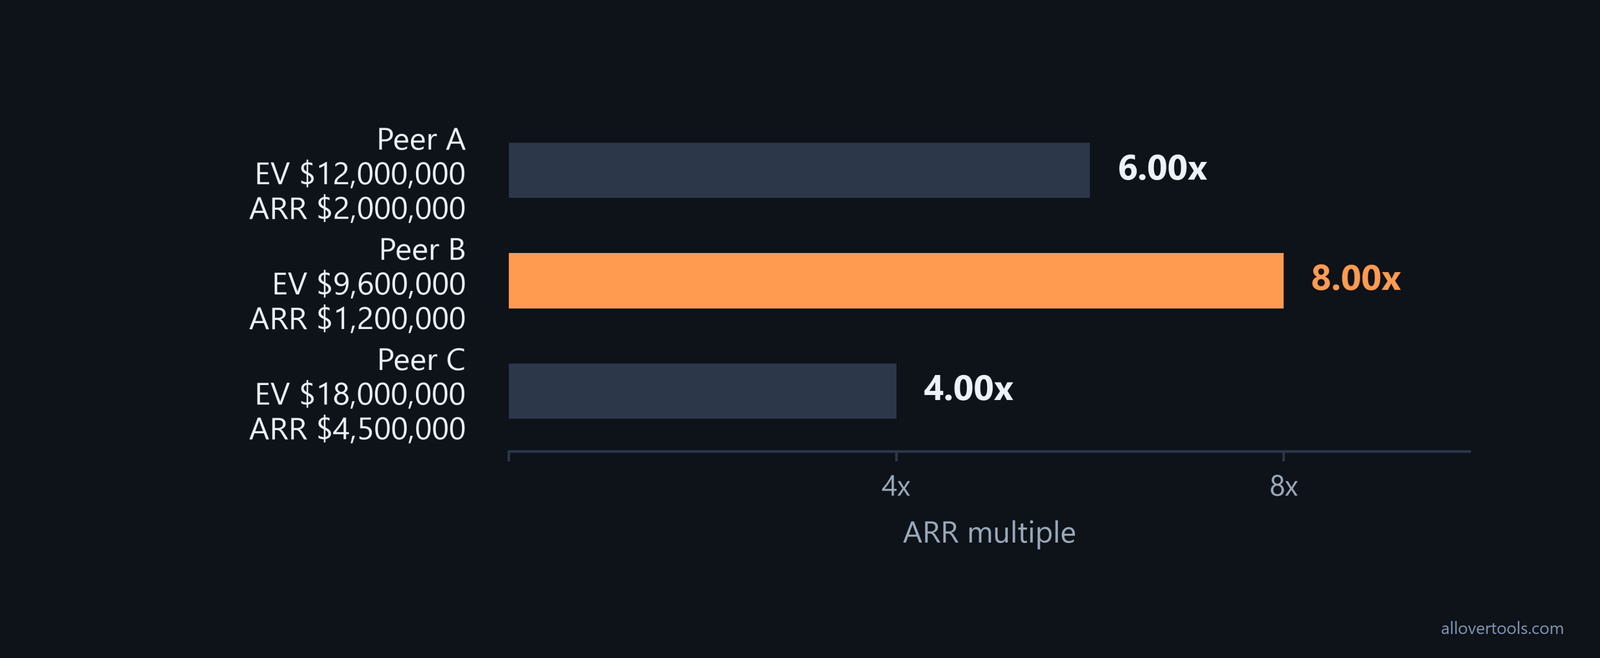
These ARR multiple examples for SaaS companies use fictional peers and fixed values. Each result is EV divided by ARR, not a market statistic.
| Peer | Enterprise value | ARR | ARR multiple |
|---|---|---|---|
| Peer A | $12,000,000 | $2,000,000 | 6.00x |
| Peer B | $9,600,000 | $1,200,000 | 8.00x |
| Peer C | $18,000,000 | $4,500,000 | 4.00x |
Before comparing the ratios, align the recurring-revenue definition, valuation timing, currency, customer mix, growth, retention, margins, and concentration. Look at the spread instead of copying the highest or lowest multiple, and record why each peer is comparable. Peer B has the highest multiple without the highest enterprise value, so size alone does not explain the ratio.
Benchmark bands by growth, retention, and deal type
Private-market benchmark bands are easier to interpret when they are tied to operating thresholds. Founderpath’s valuation calculator presents these current norms, which shift with market cycles:
| Growth profile | ARR growth | Indicative ARR multiple | NRR note |
|---|---|---|---|
| Elite growth | 100%+ year over year | 15–25x | 120%+ NRR can add a 2–3x premium |
| Strong growth | 50–100% year over year | 8–15x | 120%+ NRR can add a 2–3x premium |
| Moderate growth | 20–50% year over year | 5–8x | 120%+ NRR can add a 2–3x premium |
| Below-20% growth | Below 20% year over year | 3–5x | 120%+ NRR can add a 2–3x premium |
A separate private-market threshold puts the median private SaaS company in 2026 at approximately 4–5x ARR. Companies above 120% NRR and above a 50 Rule of 40 score reach 7–9x ARR multiples, according to L40’s 2026 thresholds. Rule of 40 here means growth rate plus profit margin. Use both thresholds to check whether a premium band is supported, rather than arguing for a premium from growth alone.
Deal context changes the comparison. In the founder-led lower middle market, most SaaS transactions clear between 3x and 6.5x ARR. The top quartile of disclosed deals prices above 8x ARR, according to the lower-market range. A bootstrapped $1–5m ARR business should start with that founder-led transaction context, rather than assuming a venture-scale or public-company benchmark applies.
Check the weighting before using a headline average. For public SaaS companies in 2026, the market-wide average EV/revenue multiple is 6.88x and the median is 4.13x. The equal-weighted SaaS Capital Index reports a 3.2x median public ARR multiple as of June 30, 2026. The average is market-cap weighted and dominated by a small number of large, richly valued businesses, as this benchmark comparison explains.
Public-market results can vary widely. A published snapshot reports a 17x median ARR multiple for public SaaS companies, a 75th percentile around 26x, and a general SaaS range of 4x–9x, as the percentile snapshot reports. Beside any number you use, record the population, percentile, and denominator. Otherwise, the upper tail can become an unjustified private-company target.
Public and private deals are different markets. A public SaaS dollar of revenue is valued at more than twice what the same dollar of ARR would fetch in a private deal, with the public-to-private valuation gap around 2x–2.5x, according to the public-private gap. Discount a public comp before using it in a private fundraising or sale discussion instead of applying the public multiple directly.
Stage and geography belong in the benchmark definition. ScaleXP structures six reports around revenue growth, CAC payback, funding by stage, cash burn, R&D spend, and ARR valuation multiples. The reports run from Seed to Series D and are based on UK, US, and European SaaS companies, as its benchmark framework shows. Match a Seed-stage UK or European business with the relevant stage and region, then read the ARR multiple alongside CAC payback and cash burn instead of using a Series D US figure in isolation.
A like-for-like peer comparison checklist
- Check the same ARR inclusions.
- Check the same EV-to-equity treatment.
- Check the same currency and valuation date.
- Compare similar recurring-revenue quality.
- Assess differences in growth, retention, margin, customer concentration, contract length, and risk.
The peer range is a reference set, not a standalone valuation answer.
Before comparing a benchmark with EV ÷ ARR, check how it was constructed. SaaSValuation.io’s Multiple Index calculates each public-company revenue multiple as market capitalization divided by annualized revenue, then reports the monthly median, as the index methodology states. In that method, annualized revenue is the current month’s revenue multiplied by 12. It is not the same denominator as strictly defined ARR, and it does not use enterprise value. Write down both numerator and denominator for the index you choose.
Revenue periods vary across data providers. The SaaS Capital Index divides market capitalization by run-rate revenue, Clouded Judgement divides enterprise value by forecast revenue for the next 12 months, and Software Equity Group and Aventis Advisors divide enterprise value by revenue for the last 12 months, as this provider comparison sets out. Match the benchmark’s valuation basis and revenue period to your own before treating the result as an apples-to-apples peer multiple.
Why SaaS valuation ARR multiples expand or contract
Durable ARR growth can support a higher multiple when retention and efficient economics support it. Contraction, churn, customer concentration, weak gross margin, poor cash conversion, short or uncertain contracts, and dependence on one customer can push the ratio down. Predictable recurring revenue and a clear expansion path make the revenue base easier to assess.
Not every diligence item deserves equal weight. The three main inputs are growth rate, net revenue retention, and margin efficiency, often summarized in a Rule of 40 or Rule of 50 score. Contract structure and customer concentration adjust the number at the margins, according to the driver hierarchy. Build the valuation case in that order: show the ARR growth rate, NRR, and profit conversion first, then document contract and concentration effects as adjustments.
Multiple expansion depends on the market cycle as well as the company. A typical benchmark for US SaaS companies was around 6x ARR in early 2023, compared with the 15–20x highs seen in the low-interest-rate environment of 2021. The rate-cycle comparison attributes part of the change to interest rates and the time value of money. Keep the valuation date and market environment beside any peer multiple, because the same ARR growth and retention profile can be judged under a different discount-rate environment.
The SaaS Metrics Calculator has a Period type setting: Monthly - figures below are for one month, or Annual - figures below are for one year. It calculates recurring-revenue movements from the period entered.
Growth can raise ARR and the multiple separately
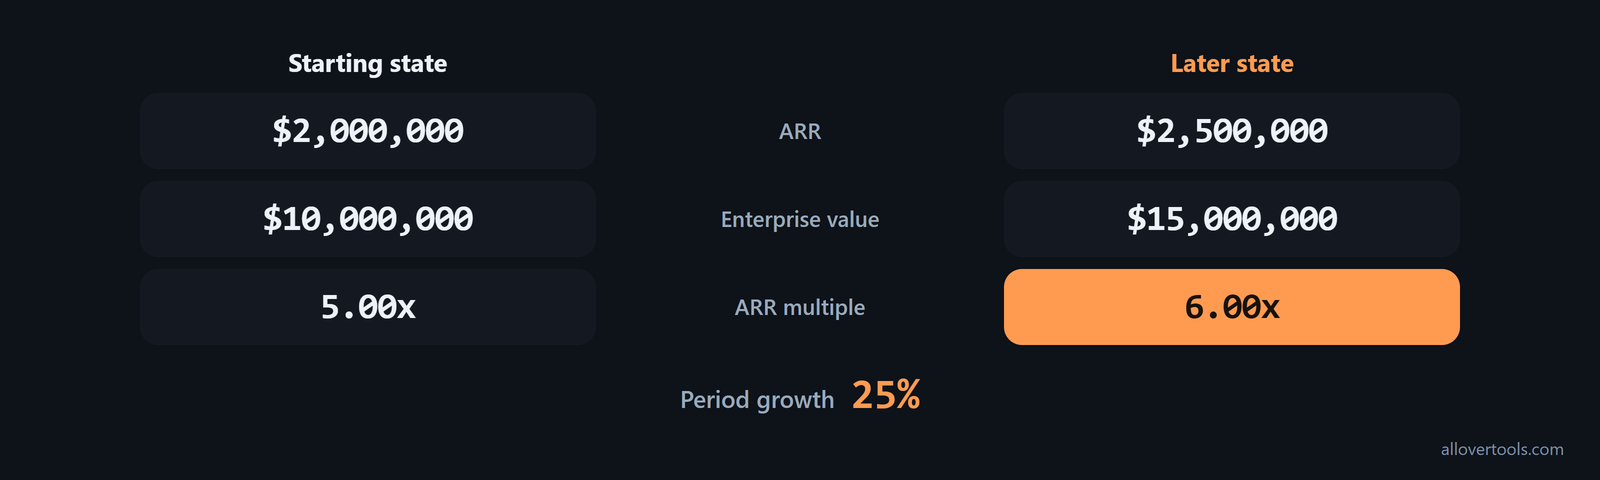
Select Annual and enter these values for one period:
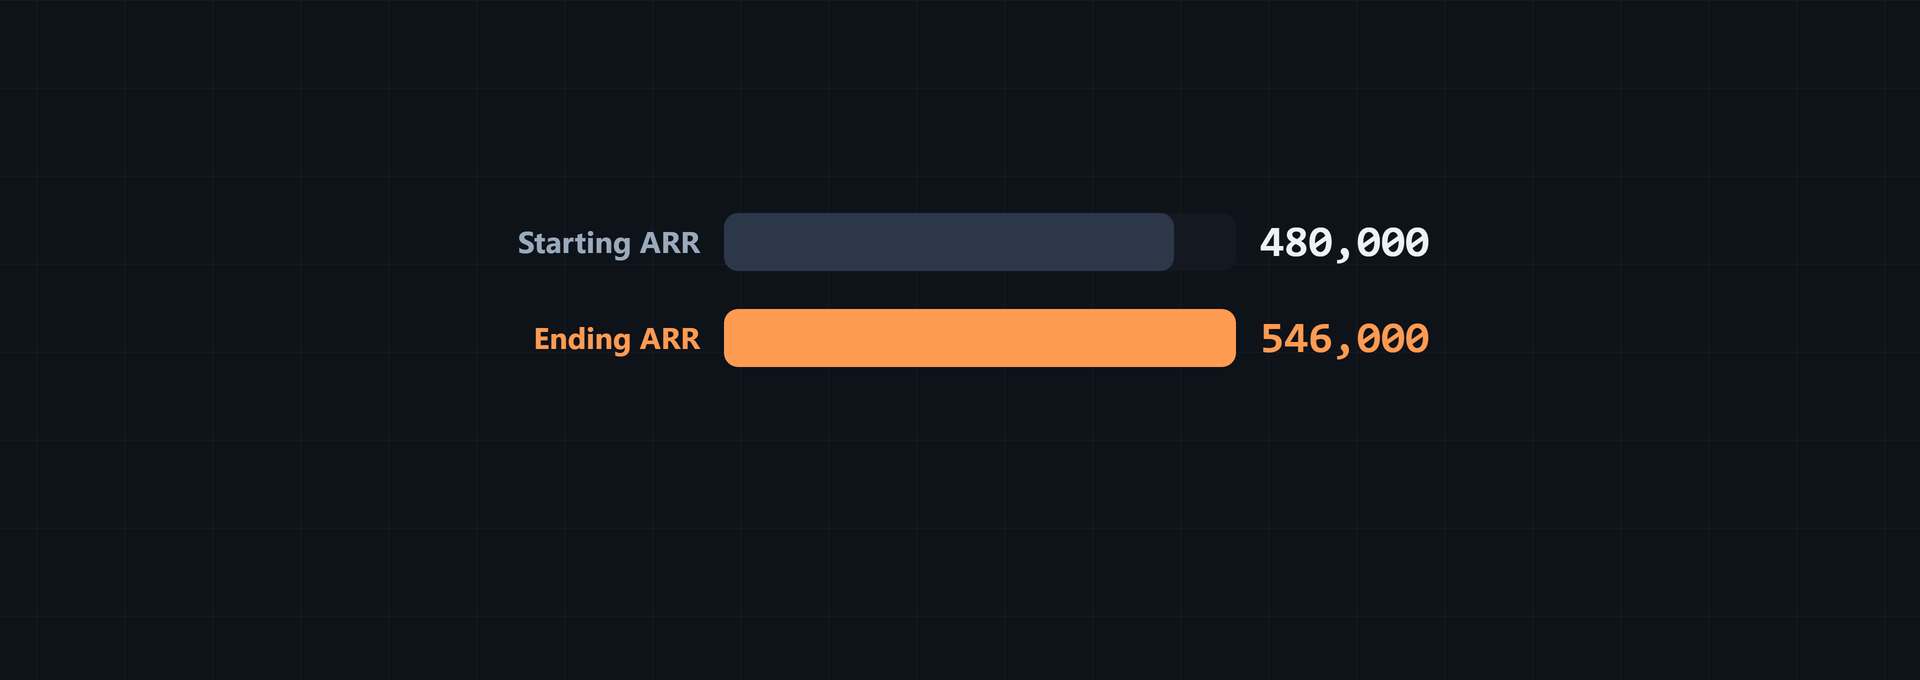
Starting ARR             $2,000,000
New business recurring   $300,000
Expansion recurring      $200,000
Contraction              $0
Churned revenue          $0

Ending ARR = $2,000,000 + $300,000 + $200,000 - $0 - $0
           = $2,500,000
Period growth = ($2,500,000 - $2,000,000) ÷ $2,000,000
              = 25%
At a starting EV of $10,000,000, the starting multiple is:
$10,000,000 ÷ $2,000,000 = 5.00xAt a later EV of $15,000,000, the calculation is:
$15,000,000 ÷ $2,500,000 = 6.00xBoth ARR and EV change here. The example shows multiple expansion, but it does not prove that growth caused it.
ARR multiple versus revenue multiple in fundraising
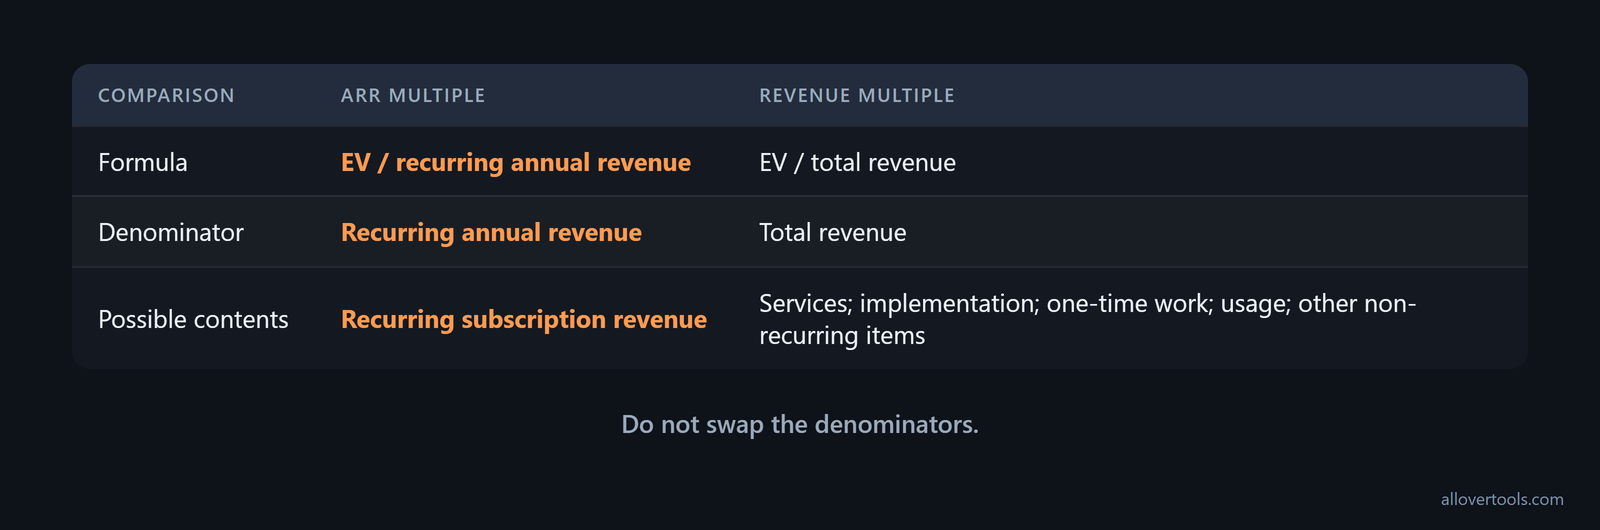
An ARR multiple is EV ÷ recurring annual revenue. A revenue multiple is EV ÷ total revenue. The ARR denominator can be more focused for a subscription business, while total revenue may include services, implementation, one-time work, usage, or other non-recurring items. The ratios answer different questions and should not be swapped.
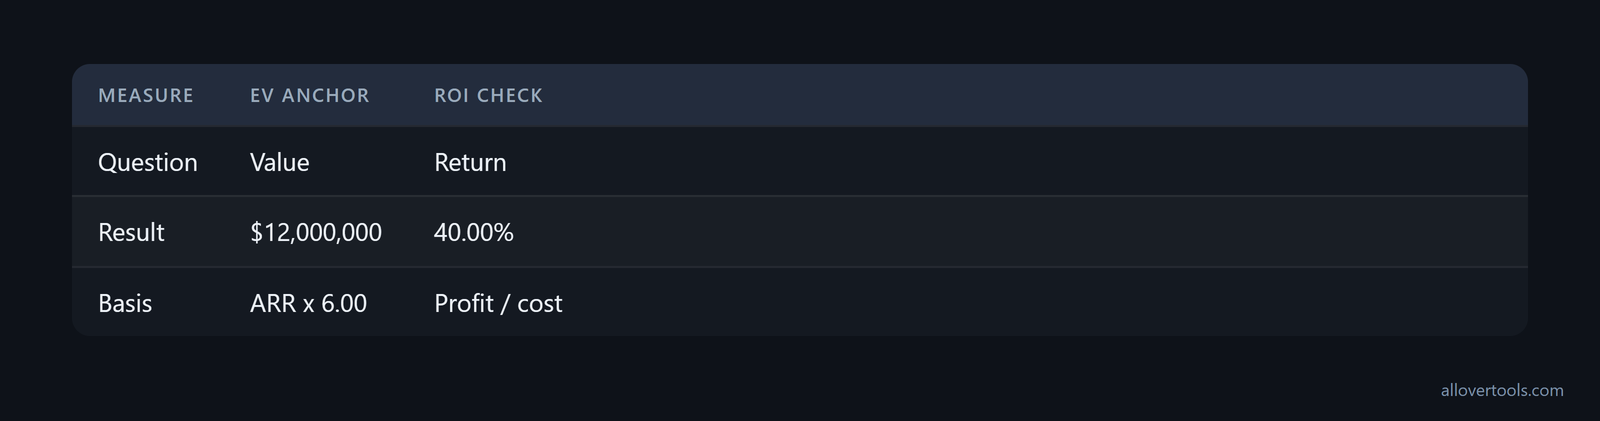
For ARR based investor pricing, agree on the ARR definition and measurement date. Calculate an implied EV at more than one multiple, reconcile EV with debt and cash before discussing equity value, document the assumptions, and check the result against cash generation. With ARR of $2,000,000 and a 6.00x target:
Implied EV = $2,000,000 × 6.00 = $12,000,000Negotiation shorthand can sit well above a normal private-market band, but it has a specific meaning. The "10x rule" is a loose venture-market convention: high-growth SaaS businesses, typically growing at 100% or more annually, can command approximately 10x ARR or higher, as the 10x rule explanation describes. Treat it as shorthand for an exceptional growth profile, not as a default price for an average SaaS company. Test the proposed multiple against the growth, NRR, margin, stage, region, and market-cycle evidence above.
When SaaS investors switch to EBITDA multiples
ARR is not always the main valuation lens. Most mid-market SaaS companies trade on a multiple of ARR or EBITDA. The ARR framework applies when growth is the primary value driver or the company is not yet optimized for profitability, according to L40’s valuation guide. As profitability becomes more central, expect an EBITDA multiple to become the comparison. Keep the ARR multiple for the growth-led case, but prepare the EBITDA view when the business is being judged on profit as well as expansion. This keeps a revenue-based ratio from carrying the whole negotiation after the investor’s valuation lens has changed.
Similar-looking multiples can still use different bases. In 2026, public SaaS companies trade at a median of about 4x revenue, private SaaS acquisitions close at about 4x revenue, and small owner-run SaaS businesses typically sell for about 4x profit, according to the cross-market comparison. A 4x ARR revenue multiple is not a 4x profit multiple. Before comparing a micro-SaaS sale with a venture or private-company ARR discussion, identify whether the base is revenue or profit.
Separate valuation ratio from investor return
A separate ROI scenario uses these inputs:
Investment cost = $3,000,000
Fees = $0
Proceeds = $4,200,000
Income = $0

Total cost basis = $3,000,000 + $0 = $3,000,000
Net profit = $4,200,000 + $0 - $3,000,000 = $1,200,000
ROI = $1,200,000 ÷ $3,000,000 × 100 = 40.00%
The ROI Calculator uses Investment cost, Fees, Proceeds, and Income for this return check. Keep enterprise value, equity value, ownership, fees, proceeds, and income on separate lines in a negotiation model. This ROI scenario tests a return assumption; it does not convert an ARR multiple into ownership or a promised outcome.
How to cross-check an ARR multiple with DCF
A DCF or NPV cross-check values forecast cash flows instead of applying a revenue ratio. Set the cash-flow forecasts and an annual discount rate, discount each cash flow to the valuation point, add the present values, and compare that total with the EV implied by the ARR multiple.
An ARR multiple can resemble a payback period, but only as a rough heuristic. The question is how long the current valuation would take to equal the current ARR if ARR were stable and cash-flow-like. SaaS businesses often use it instead of P/E because early-stage companies may operate at a loss, as the payback interpretation explains. ARR is not free cash flow. Margins and growth change over time, and future periods must be discounted. A 6x ARR multiple therefore does not mean a six-year payback in a DCF. Compare the ratio with the cash-flow and discount-rate assumptions instead.
The Cash Flow Valuation Calculator shows one-time, recurring, or dated schedules through a timeline, cash-flow table, and discount factors. The NPV Calculator accepts By period (Year 0, 1, 2, ...) or dated cash flows with Annual discount rate (%). Both tools use entered values and do not estimate the discount rate.
A chosen DCF cross-check in numbers
Using a terminal value of $10,000,000 in Year 4, the inputs are:
Year 1 cash flow = $1,200,000
Year 2 cash flow = $1,400,000
Year 3 cash flow = $1,600,000
Year 4 cash flow = $1,800,000
Year 4 terminal value = $10,000,000
Year 4 total = $11,800,000
Annual discount rate = 10.00%

PV/NPV = $1,200,000/(1.10)^1
       + $1,400,000/(1.10)^2
       + $1,600,000/(1.10)^3
       + $11,800,000/(1.10)^4
       = $11,509,596.34

DCF-implied multiple = $11,509,596.34 ÷ $2,000,000 ARR
                     = 5.75x
The difference from the 6.00x ratio comes from the cash-flow, discount-rate, and terminal-value assumptions. It is not, by itself, a calculation error. Test different discount rates, cash-flow forecasts, and terminal values instead of treating one output as a precise market truth.
Use dated benchmarks as context, not permanent rules. In Q1 2023, Klipfolio reported a median ARR multiple of approximately 6.7x for US SaaS companies, with a typical range of 3x to 15x, in that historical snapshot. Since the benchmark is tied to a named quarter, check a current, consistently defined peer set before using 6.7x in a present valuation or treating the 3x–15x band as a target.
Limits of ARR multiple valuation
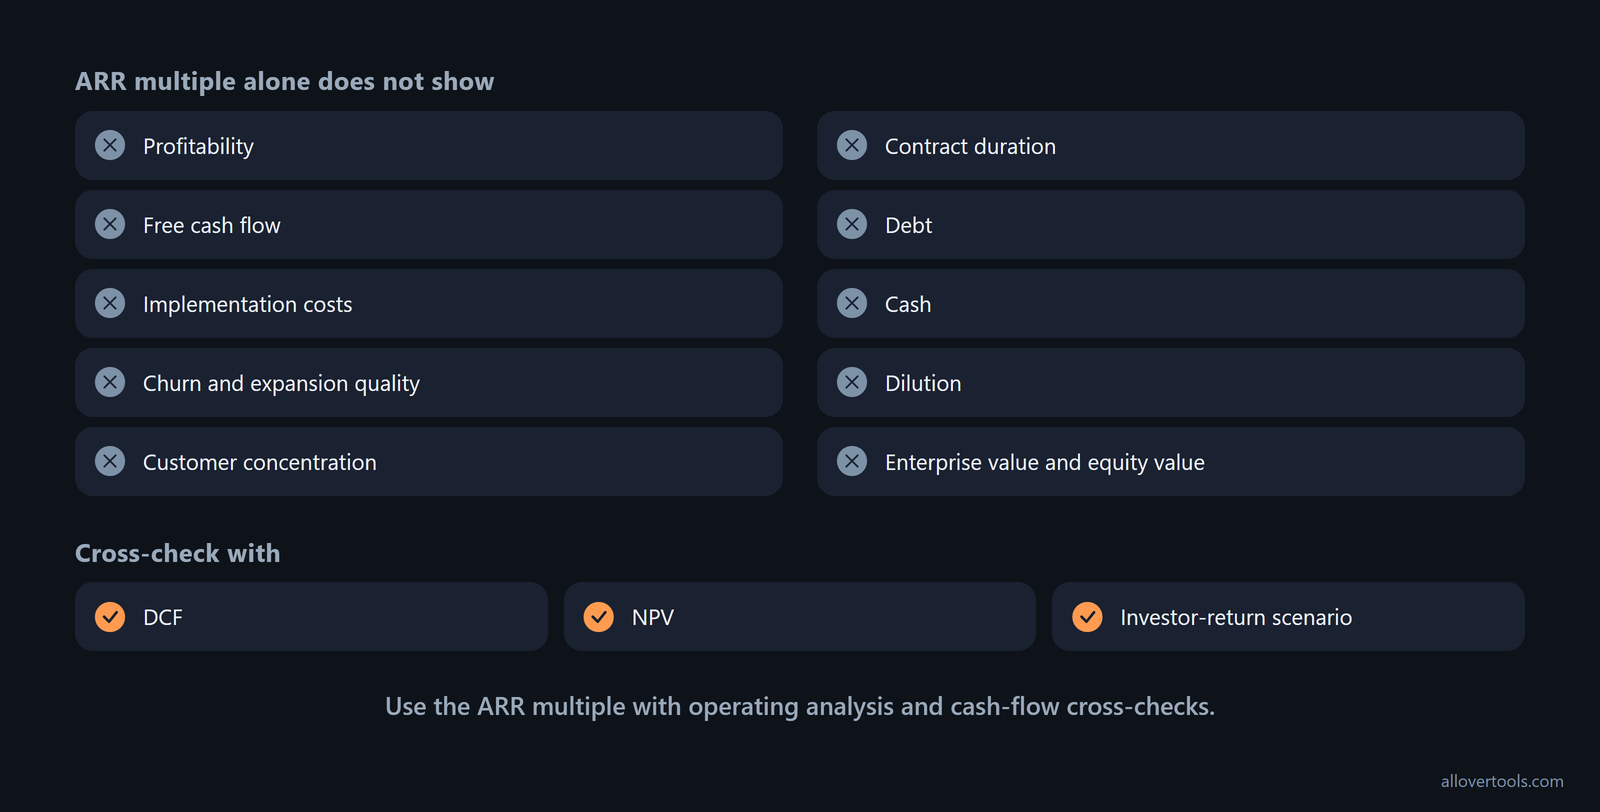
ARR multiple valuation cannot show profitability, free cash flow, implementation costs, churn and expansion quality, customer concentration, contract duration, debt, cash, dilution, or the difference between enterprise value and equity value on its own. ARR can be overstated by including one-time or non-recurring revenue, and it becomes incomparable when companies use different inclusion rules.
Calculate the ratio, compare consistently defined peers, inspect the operating drivers, translate EV carefully, and reconcile it with DCF or NPV plus a separate investor-return scenario. No multiple is universally good or bad.
Frequently asked questions
What is a good ARR multiple for a SaaS company?
There is no universal good multiple. Compare consistently defined peers, then weigh growth quality, retention, margins, concentration, cash flow, and the assumptions behind a DCF rather than using the ratio alone.
How do you calculate an ARR multiple?
Divide enterprise value by annual recurring revenue. With the chosen example of $12,000,000 EV and $2,000,000 ARR, the result is 6.00x.
Is an ARR multiple the same as a revenue multiple?
No. An ARR multiple uses recurring annual revenue, while a revenue multiple uses total revenue, which may include non-recurring or service revenue.
Does higher ARR always mean a higher valuation?
No. ARR size is only the denominator; enterprise value also reflects the durability, growth, retention, margins, concentration, cash flow, and risks of that revenue.
Can I use an ARR multiple in a fundraising negotiation?
Yes, as one valuation anchor after agreeing the ARR definition and measurement date. Reconcile the implied enterprise value with debt, cash, equity terms, dilution, and a cash-flow cross-check before treating it as investor pricing.