Utilization income forecasting starts with the hours available for work, the share that can be billed, and the rate charged for those hours. Start with billable capacity rather than total time worked, then compare lower and higher utilization cases. Reserve non-billable weeks before calculating income, and keep forecasted revenue separate from invoices and cash collected.
Define utilization and billable hours for the forecast
Utilization is billable hours divided by total working hours, expressed as a percentage. Total working hours include client work and time spent on admin, sales, proposals, training, and planned time off. Billable hours are the part of that total that can be invoiced.
Use the same definition for a month and a year:
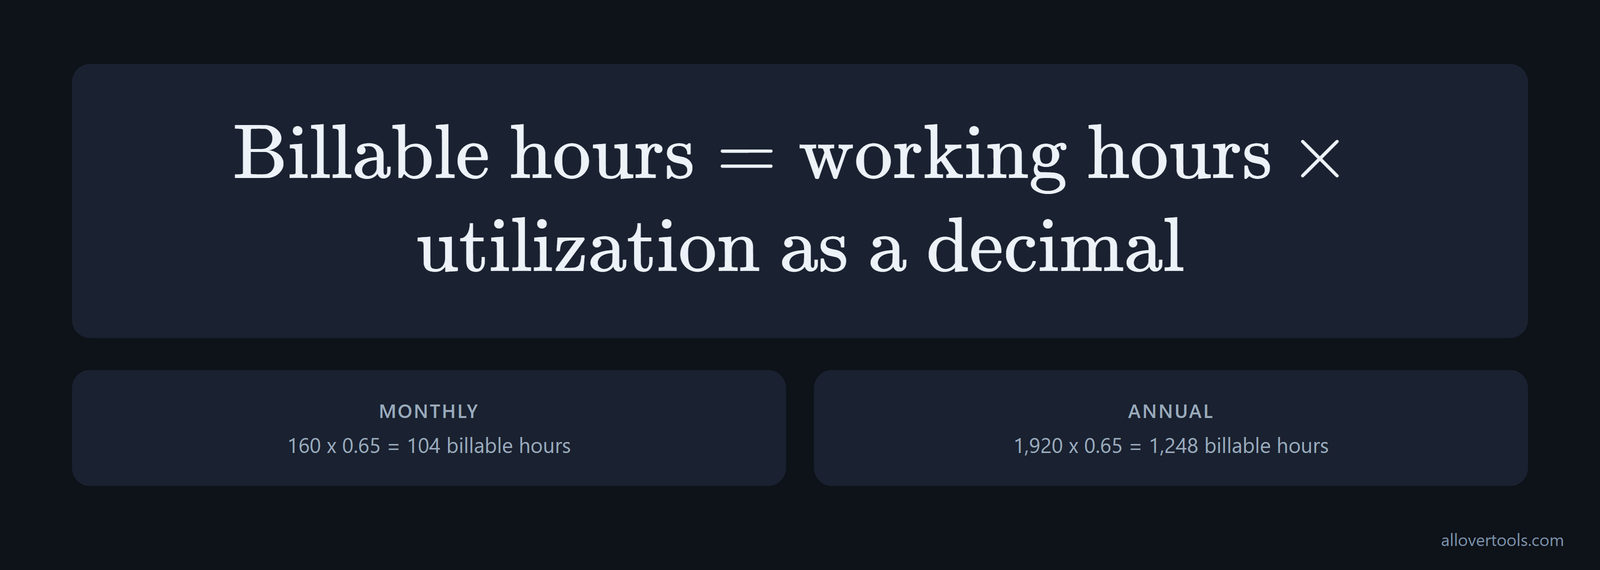
Billable hours = working hours × utilization as a decimal

Monthly: 160 × 0.65 = 104 billable hours
Annual: 1,920 × 0.65 = 1,248 billable hours
These figures use 160 working hours per month and 65% utilization. Twelve months gives 1,920 working hours and 1,248 billable hours. The 35% that is not billable covers the work and time off included in the assumption. Leaving it out would make the forecast overstate available capacity. That is the basis of a monthly billable hours forecast.
Start with 60-70% as a sanity check for a solo freelancer's utilization. At 40 working hours per week, that gives you 24-28 billable hours. For annual planning, time-tracking data supports using 1,200-1,400 billable hours rather than assuming every working hour can be billed.
Another planning check puts solo-freelancer capacity at 1,200 to 1,500 billable hours per year. Sales, proposals, bookkeeping, training, sick days, and unpaid time off all take time, as solo-freelancer planning guidance notes. Use that range to question any forecast built around 1,800-2,000 billable hours.
For a weekly check, 25-35 billable hours is a practical range after admin, invoicing, bookkeeping, and other non-billable work. It fits a freelancer working 40 or more total hours. It is not a reason to enter 40 billable hours, as a practical range makes clear.
Write down the non-billable share instead of treating it as an unexplained percentage. the cited breakdown assigns typical time to:
- Finding clients and sending proposals: 10-15%.
- Administration, invoicing, and bookkeeping: 10-15%.
- Email and communication: 5-10%.
Put the denominator next to every utilization figure. Nordic consulting firms may aim for 85-95% of available hours. The SPI Professional Services Maturity Benchmark reports a 68.9% average and a 75% optimum when utilization uses total working hours, including internal time. Compare those figures only when the denominator matches, as the 2026 guide explains.
Let the type of work set the scenario range. In 2024, IT consulting averaged 71.0% billable utilization and management consulting averaged 67.4%. There is no single "good" utilization rate for both contexts, according to the sector comparison.
Broader professional-services data gives you another reference point. Average billable utilization was 66.4% in 2025, down from 68.9% in 2024. The 2024 result was below the 75% optimal threshold reported from Service Performance Insight benchmarks, as the benchmark summary reports. Keep the freelancer's own admin and sales load in the denominator when you use that comparison.
Calculate the billable rate needed for an income target
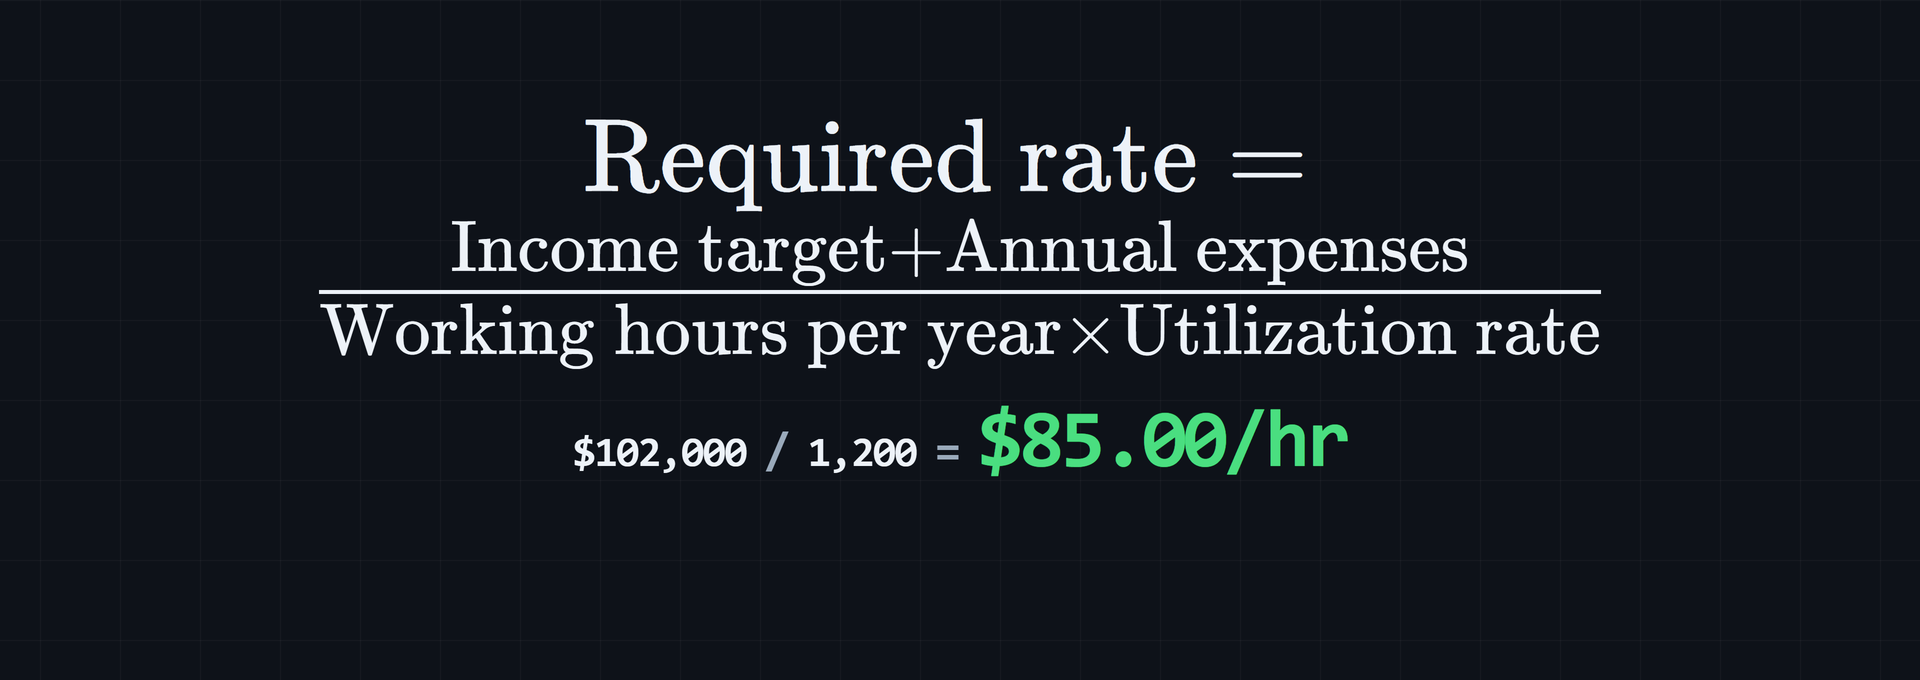
A required rate tells you what to charge for a target. A revenue projection tells you what a given rate might produce. The rate calculation is:
Required rate = (Income target + Annual business expenses)
                ÷ (Total working hours per year × utilization rate as a decimal)
Using the annual example:
Income target: $72,000
Annual business expenses: $12,000
Total working hours: 1,920
Utilization: 65%

Billable hours: 1,920 × 0.65 = 1,248
Total revenue required: $72,000 + $12,000 = $84,000
Required rate: $84,000 ÷ 1,248 = $67.307692... = $67.31/hour
The monthly figures reach the same result. A $6,000 target plus $1,000 in expenses requires $7,000 in monthly revenue. Dividing $7,000 by 104 billable hours gives $67.307692..., displayed as $67.31 per hour.
To predict freelance income from a billable rate, enter Annual income target, Annual business expenses, Total working hours per year, and Utilization rate (%) in the Billable Hourly Rate Calculator, then select Calculate rate. Currency symbol changes the display format only. The calculation uses the values entered in the browser and does not fetch live rates or other external data.
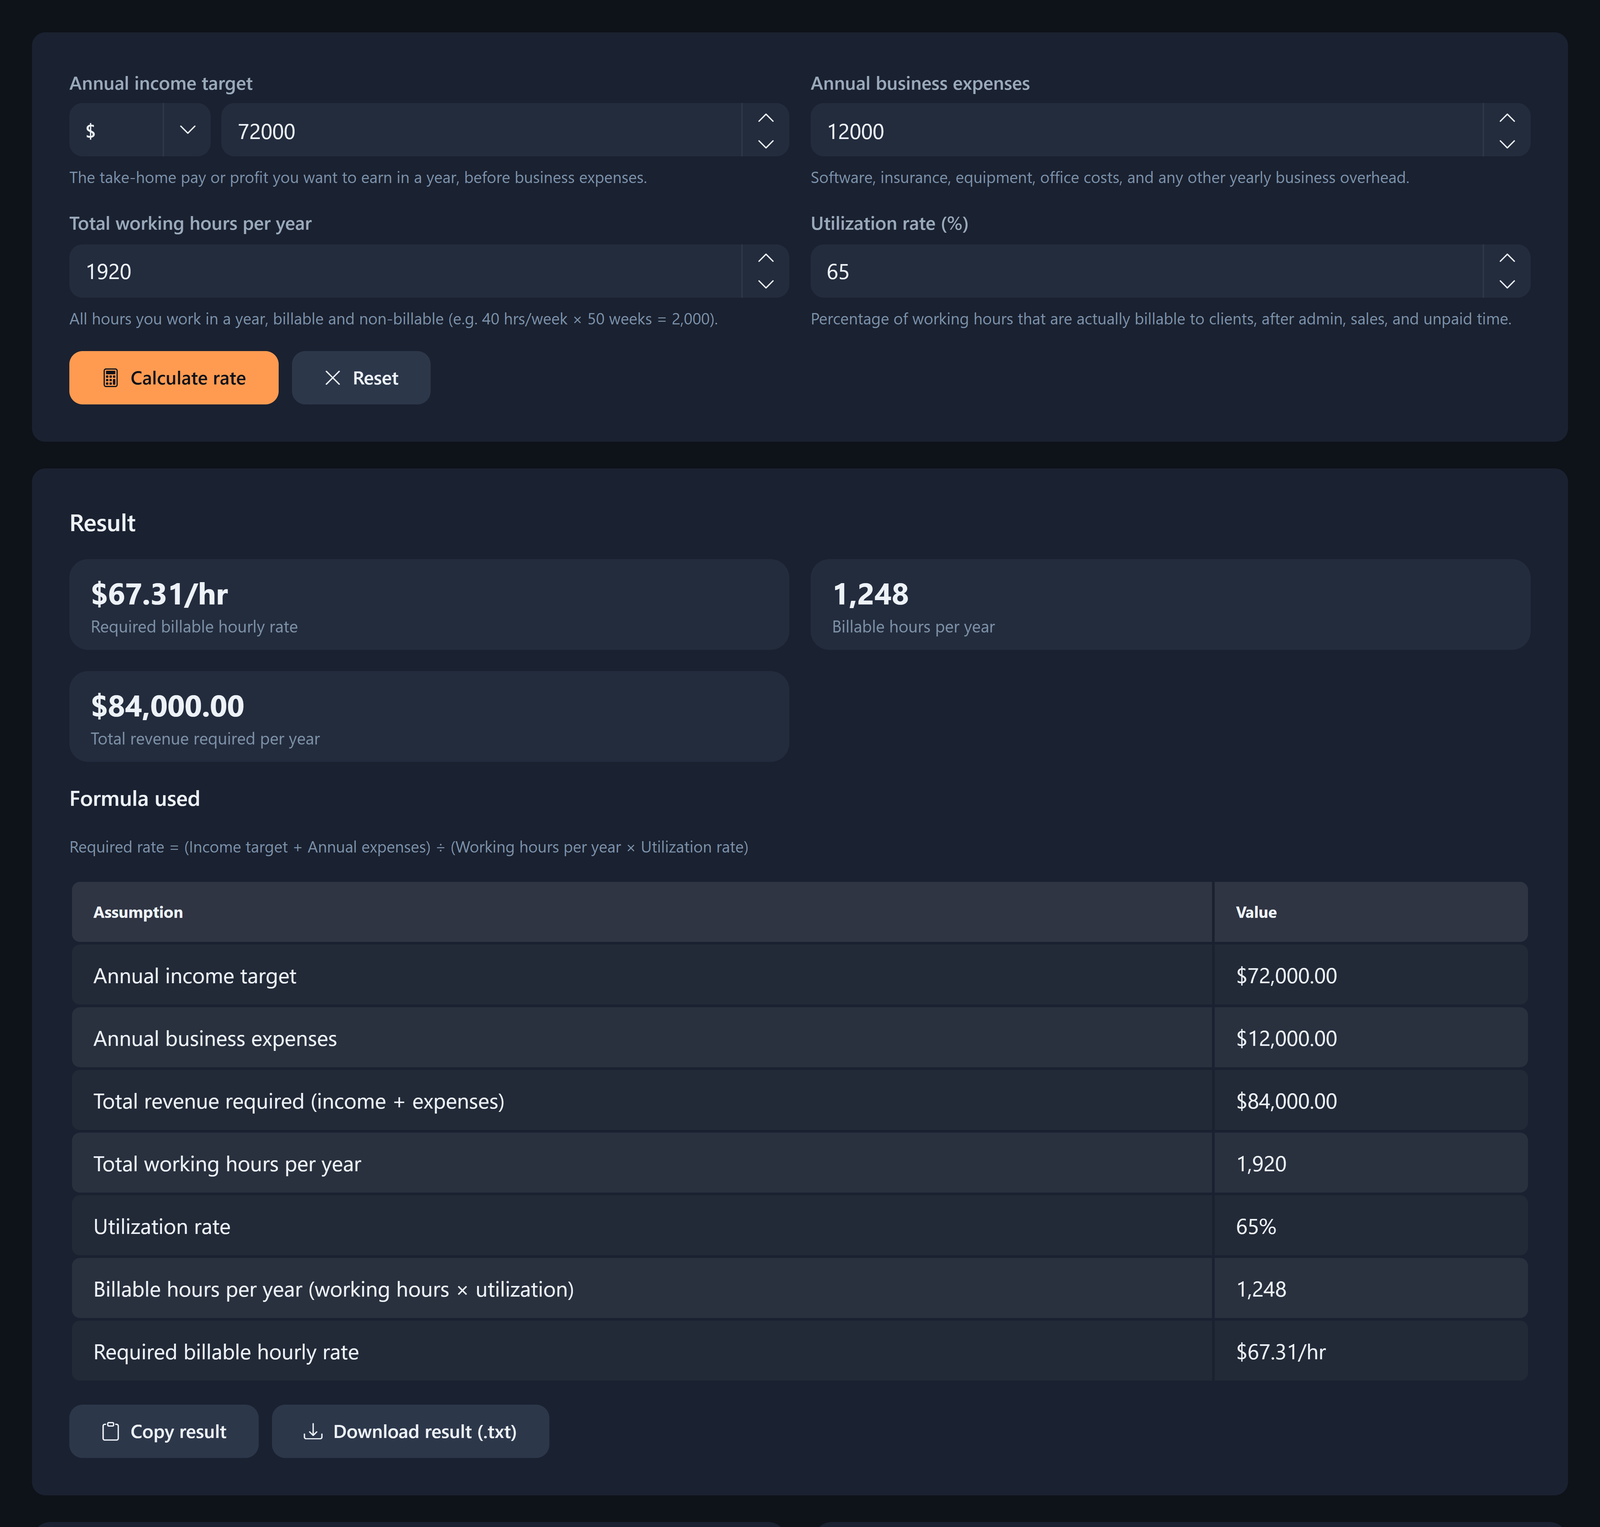
The result includes billable hours, total revenue required, and the required rate. Reset clears the result. Copy result and Download result (.txt) keep the calculation in text form.
Gross up a take-home target for tax before dividing by billable capacity. The tax-buffer formula is "Revenue needed = take-home ÷ (1 - tax%) + business costs," followed by "Hourly rate = revenue needed ÷ (billable hrs/week x working weeks)." Watch the denominator: a freelancer working 40-hour weeks typically bills only 25-28 of them. A 60-70% utilization rate is a realistic ceiling, as the tax-buffer formula sets out.
Show taxes and self-funded benefits on their own lines rather than folding them into a general expense estimate. The full minimum-rate formula adds target income, overhead, benefits substitute, and tax reserve, then divides by billable hours. the worked rate example uses:
- $101,000 of target income.
- $15,000 of overhead.
- $22,000 for self-funded benefits.
- $32,000 reserved for taxes.
Those inputs produce $170,000 to recover and a $125 hourly rate when divided by 1,360 billable hours. That is why the rate needed to fund the business can be much higher than personal income divided by hours.
Use the rate that holds up after the work is delivered, not just the rate on the proposal. The end-to-end forecast is "freelance income = (effective rate x realistic billable hours x (1 - pipeline gap)) - expenses - platform fees - tax." Here, effective rate means total revenue divided by total work time after discounts, legacy pricing, and small write-offs, according to the effective-rate formula.
Keep a minimum survivable floor separate from a risk-adjusted target. Calculate the floor as annual required gross income divided by annual billable hours. Then add delay risk, dispute risk, and non-billable load to the target. Before sending a quote, run a delayed-payment scenario and check that the effective hourly result still clears the floor, following the cash-flow guidance.
Build low, base, and high monthly income projections
A projection uses the rate and expected billable hours: rate x billable hours. The cases below use a $70 rate and 160 working hours per month. They are low, base, and high scenarios, not predictions or benchmarks. Each annual figure is the monthly amount multiplied by twelve.
Compare utilization scenarios
| Scenario | Utilization | Monthly billable hours | Monthly revenue | Annual revenue |
|---|---|---|---|---|
| Low | 50% | 160 x 0.50 = 80 | 80 x $70 = $5,600 | $5,600 x 12 = $67,200 |
| Base | 65% | 160 x 0.65 = 104 | 104 x $70 = $7,280 | $7,280 x 12 = $87,360 |
| High | 80% | 160 x 0.80 = 128 | 128 x $70 = $8,960 | $8,960 x 12 = $107,520 |
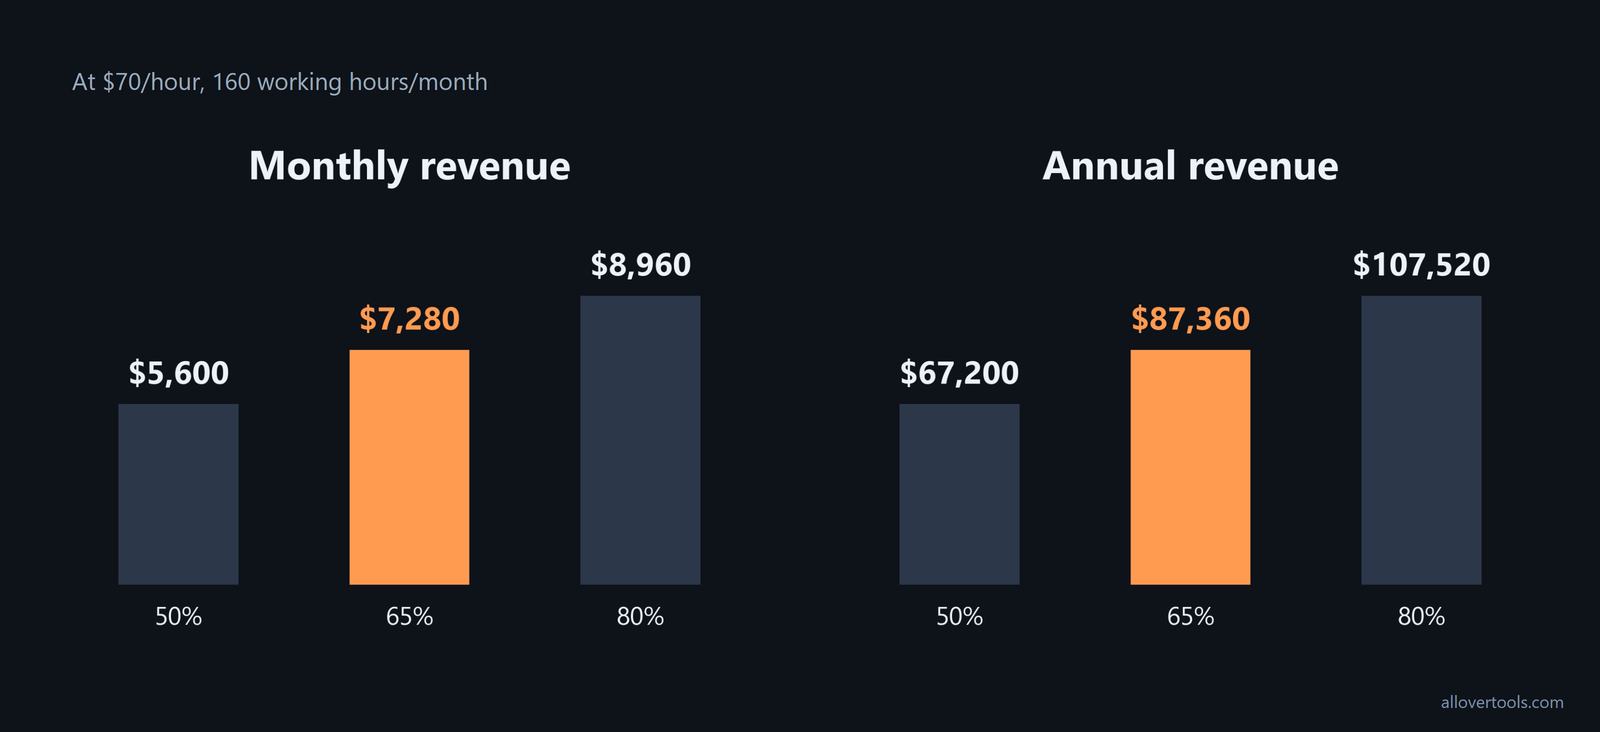
This scenario planning for freelancers makes the effect of utilization easy to see. At the same rate, utilization changes the number of billable hours. A rate change affects the revenue earned from each billable hour. If the rate is the unknown, run the rate calculator with the target, expenses, working hours, and utilization for that case.
Build the annual total from twelve monthly estimates, not one annual guess. Lay out each month from calendar data and include slower periods such as August and December. Freelancers who do this honestly often find that the real annual billable-hours figure is 10% to 20% lower than expected, according to the monthly forecast guidance. If historical tracking shows consistent overestimation, reduce the annual utilization assumption by 10-20%.
For project-based work, compare rate x hours with average project value x the number of projects you can genuinely close and deliver each month. The buyer also matters. Project volume usually caps income before the rate or available hours do, as the project-throughput advice explains.
Use booked work to make the next forecast forward-looking. Forecasted utilization equals scheduled future billable hours divided by future available hours, multiplied by 100. Calculate it for the next one to three months, then turn the result into short-term income using the same rate x billable-hours logic. the forward-looking definition shows whether the current plan is likely to produce the same result next month or next quarter.
Set the forecast horizon beyond the time needed to win and start a new project. Three months is a useful minimum, with six preferred, and the horizon should be longer than the sales cycle, following the horizon rule. This gives you time to change the pipeline or the rate assumption before a capacity gap arrives.
Treat the 80% case as a stress case, not an automatic goal. Most professional-services firms target 70-80%, and about 75% is a useful calibration point. Burnout territory and attrition risk tend to appear when billable utilization stays above 80%, as the utilization research summarizes.
A high rate still has a capacity ceiling. Plutio's cited Upwork data puts the average freelancer at $47.71 per hour with 60-75% billable utilization. A typical freelancer may work 40-45 hours per week while billing only 60-75% of that time. At 30 billable hours per week for 48 working weeks and $75 per hour, the annual ceiling is $108,000, according to the growth-plan data.
Buffer the forecast for non-billable weeks
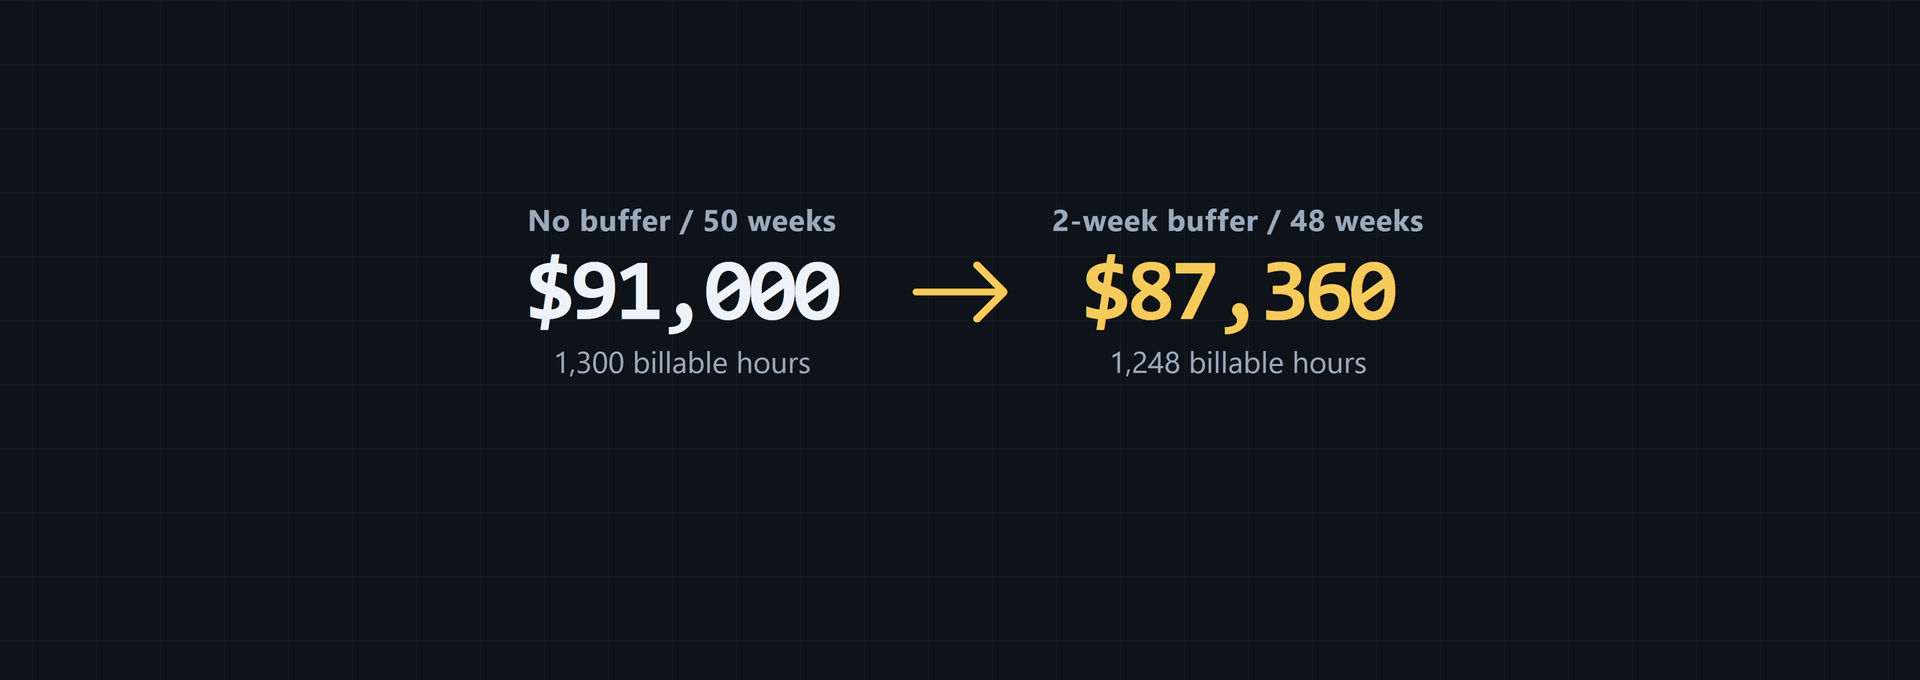
Remove planned unavailable capacity before applying utilization. Otherwise the calculation assumes that every available week can be used for client work. With 40 hours per week, 50 available weeks, and 65% utilization, the unbuffered calculation is:
Working hours: 40 × 50 = 2,000
Billable hours: 2,000 × 0.65 = 1,300
Annual revenue: 1,300 × $70 = $91,000
Now reserve a two-week non-billable buffer:
Working hours after buffer: 40 × 48 = 1,920
Billable hours: 1,920 × 0.65 = 1,248
Annual revenue: 1,248 × $70 = $87,360
Difference: $91,000 − $87,360 = $3,640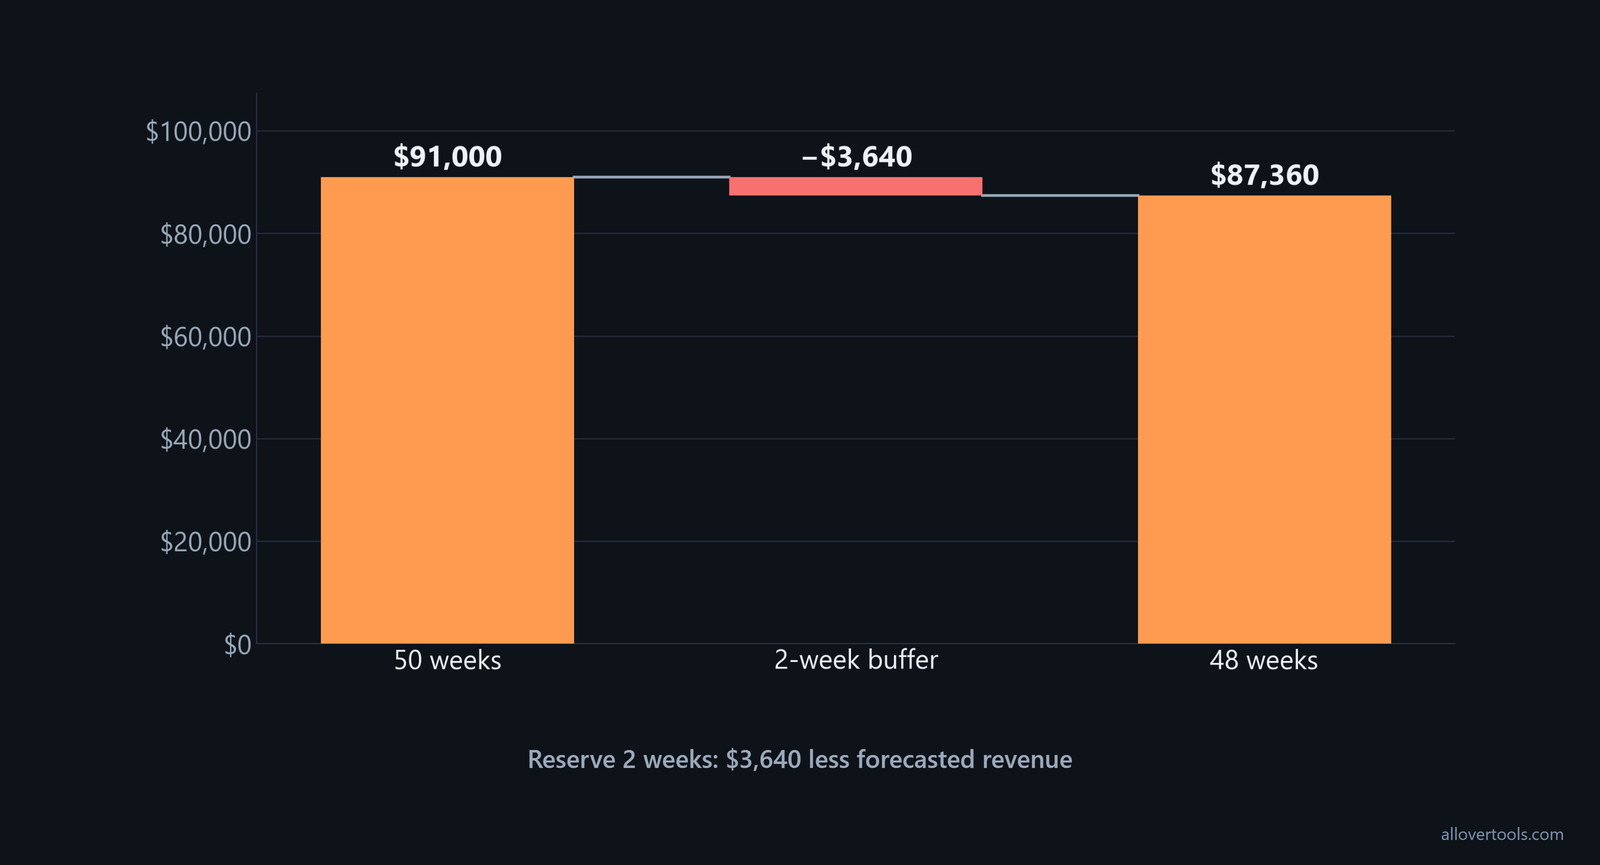
The buffer can cover vacation, holidays, illness, sales gaps, and weeks spent on internal work. This is a capacity and revenue projection, not a cash-collection forecast. Delayed invoices and unpaid work need to be tracked separately.
For project-based work, subtract the gap between engagements before you forecast income. Assume that 10% to 20% of the year may fall between projects, then multiply planned billable hours by (1 - pipeline gap), with the gap set between 0.10 and 0.20, as the pipeline-gap guidance recommends.
Use a separate collection haircut to turn billed revenue into expected cash. After forecasting business revenue, subtract business expenses, marketplace platform fees, unpaid invoices budgeted at 1% to 3%, and self-employment and income tax. Keep billed and collected revenue on separate lines, following the collection adjustment.
Connect forecasted income to savings and cash runway
A simple runway calculation is available cash reserve divided by essential monthly outflow. Forecasted revenue is not the same as cash because the billable-rate calculation does not model expenses, taxes, collection timing, or money already held.
Calculate the reserve and runway
Use the base scenario with $7,280 in monthly forecasted revenue, a 20% savings allocation, an existing $18,000 reserve, and $3,000 in essential monthly outflow.
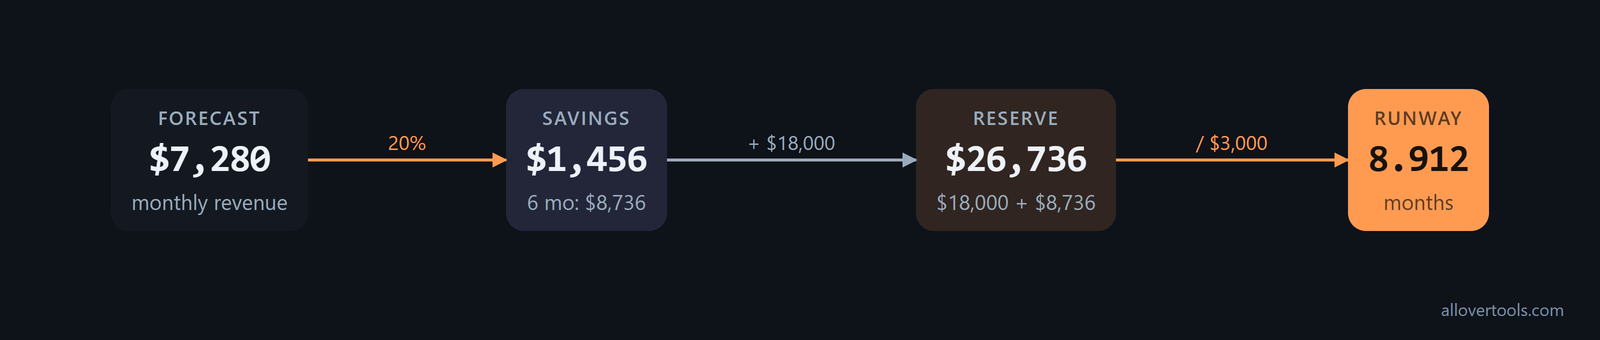
Monthly savings: $7,280 × 0.20 = $1,456
Six months of contributions: $1,456 × 6 = $8,736
Total reserve: $18,000 + $8,736 = $26,736
Runway: $26,736 ÷ $3,000 = 8.912 months
This is a zero-growth illustration. For the savings projection, enter Present value ($) = $18,000, Contribution per period ($) = $1,456, Contribution timing = End of each period, Annual interest rate (%) = 0, Term = 6, Term unit = Months, and Compounding / contribution frequency = Monthly (12/year) in the Future Value Calculator. The computed Future value is $26,736.
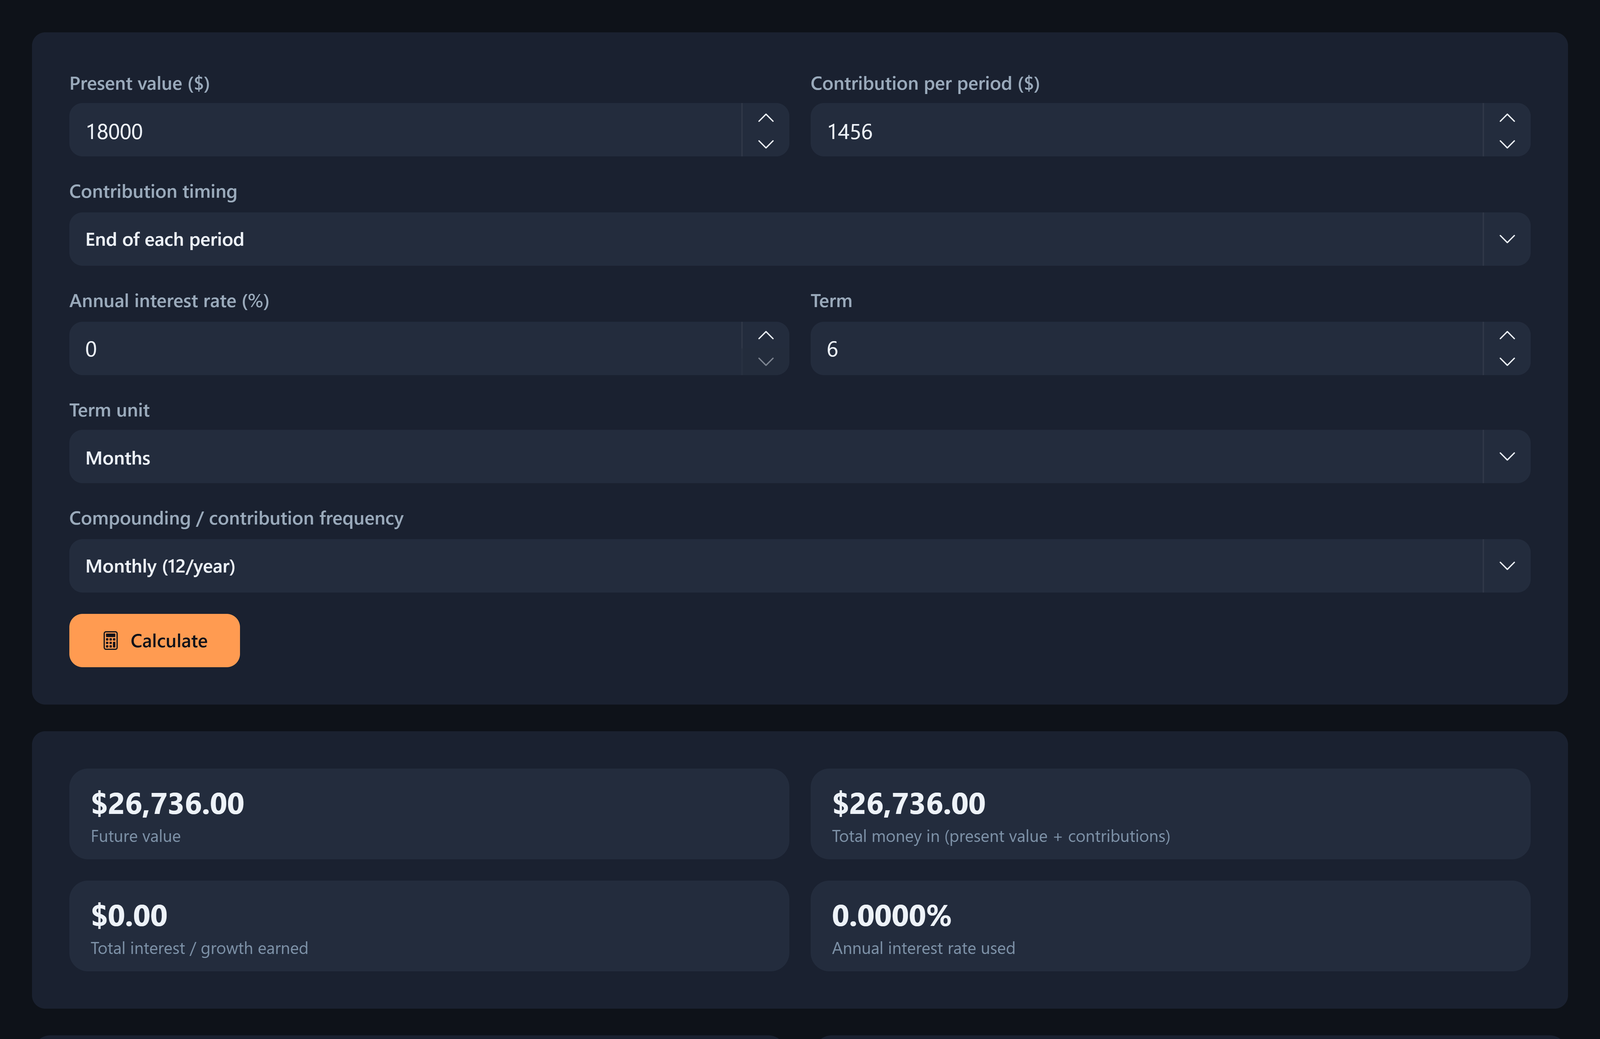
The tool calculates from entered values in the browser. It does not fetch live rates or model taxes, fees, risk, or irregular contributions. The runway division is a separate manual calculation.
Track actual income against the forecast and adjust
Review the same figures each month. Record actual billable hours, actual rate, invoiced revenue, and collected revenue separately. Compare them with the forecast, then identify whether the gap came from utilization, rate, capacity, or collection timing.
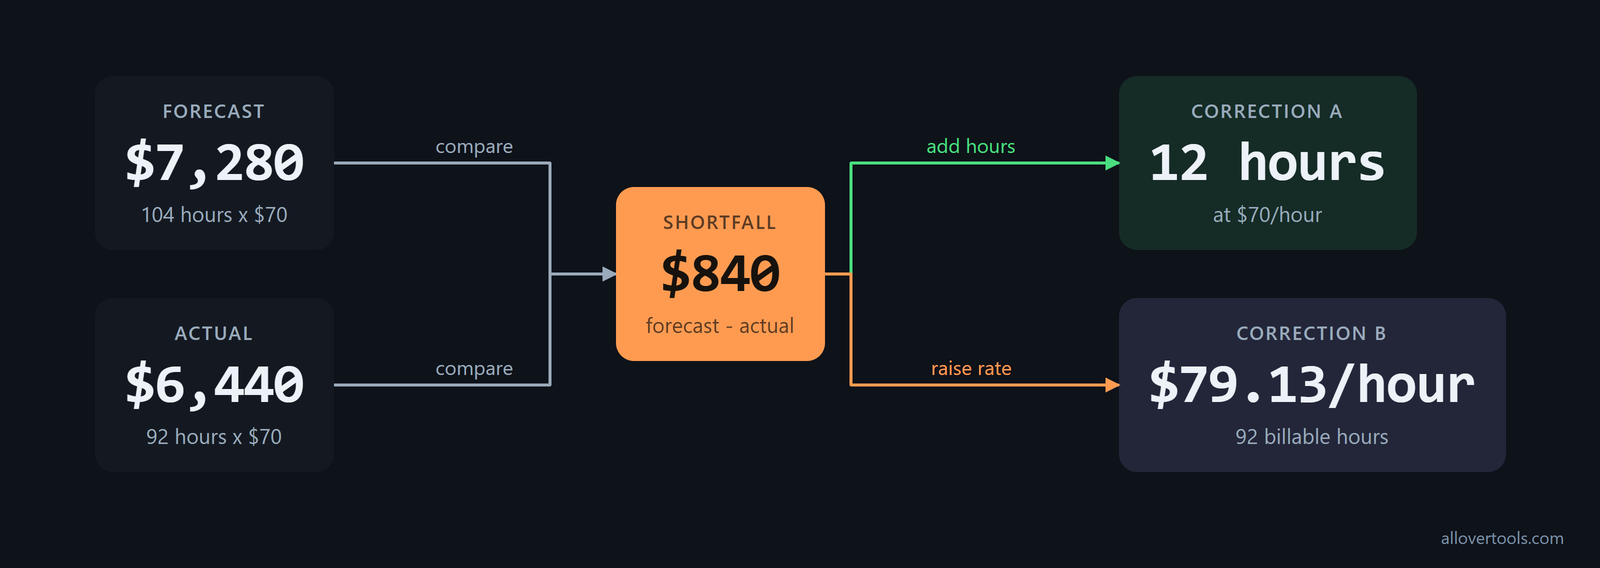
The base forecast is 104 billable hours at $70 per hour, or $7,280. If actual billable time is 92 hours at the same rate:
Actual revenue: 92 × $70 = $6,440
Gap: $7,280 − $6,440 = $840
Rate needed for $7,280 with 92 hours: $7,280 ÷ 92 = $79.130434... = $79.13/hour
Hours needed at $70/hour: 104 − 92 = 12 additional billable hours
Raise the rate when capacity is constrained. Improve utilization only when the extra billable work will not displace necessary non-billable work. If the shortfall is temporary, lowering the target or saving less may fit the situation better. A missed invoice is a collection issue, not automatically a utilization issue. A higher rate can also reduce demand, so the next forecast should record that changed assumption.
Choose the correction from the gap
Under these figures, the $840 shortfall has two clear corrections: add 12 billable hours at $70 per hour, or charge $79.13 per hour for 92 billable hours. Record either change as a new assumption. Keep invoiced and collected amounts separate because collection timing does not change the billable-hours calculation.
High utilization does not guarantee high income when billable work is not fully invoiced. Utilization measures hours worked against total available hours. Realization measures total billed hours against total billable hours, so use it to expose write-offs or discounts that make rate x billable hours overstate revenue. Agency-level realization can also help benchmark a solo freelancer who collaborates in a team, as the realization definitions distinguish.
Show better operations as a separate utilization scenario instead of quietly adding working hours. Professional-services automation adoption was associated with an average 8% relative increase in billable utilization, from 65.0% to 70.2%, according to the 2026 SPI benchmark reported in the 2026 benchmark. When time tracking, scheduling, or invoicing changes, record the revised utilization assumption and its income effect separately.
Frequently asked questions
How do you use utilization to forecast freelance income?
Multiply total working hours by utilization as a decimal to get billable hours. Then multiply billable hours by the billable hourly rate. Run low, base, and high utilization cases so the capacity assumption remains visible.
How do you predict freelance income from a billable rate?
For a month, multiply the billable rate by expected monthly billable hours. For a year, use expected annual billable hours. The hours must already account for non-billable work and planned unavailable weeks.
How should non-billable weeks affect a monthly billable-hours forecast?
Reduce working capacity for planned vacation, holidays, illness, sales gaps, or internal work before applying utilization. Otherwise the monthly and annual totals include hours that cannot actually be billed.
How do you compare an income target with actual freelance earnings?
Compare forecasted billable hours, rate, and revenue with actual hours, rate, and invoiced or collected revenue for the same period. Change the rate, capacity, utilization assumption, or target as needed, and record the new assumption.
How can a freelancer connect an income forecast to cash runway?
Apply a savings allocation to forecasted income, add that amount to the reserve, and divide the resulting reserve by essential monthly outflow. Keep runway separate from revenue because the tools do not model taxes, expenses, invoice timing, or collections.